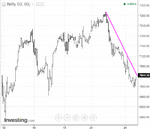
SLA approach for NIFTY50 Index

I entered at 7200 because the chart on 23rd, nifty opened high and did not even attempted to go up- continuously sliding which broke previous day low as well. So thats why I entered aggressively (this is something similar to price action method which I followed earlier).As you said, I too closed some and carrying few lots as swing still.

Let me stick with pure SLA from here...probably on hourly timeframe.

If you had followed the SLA, you would have traded the 15m as follows:

attachment.php


If you want to trade the hourly, that's fine, but the hourly isn't a time frame; it's a bar interval. Your time frame is the expanse of time within which you're trading. If you're trading an hourly bar, your timeframe will be determined by at least the daily chart. Otherwise you start focusing on the trees and ignore the forest.

You may decide at some point that the SLA is not for you. That's fine. It's not for everyone.

Db
 

Attachments

  • Insursi5.gif
    Insursi5.gif
    62.5 KB · Views: 1,500
If you want to trade the hourly, that's fine, but the hourly isn't a time frame; it's a bar interval. Your time frame is the expanse of time within which you're trading. If you're trading an hourly bar, your timeframe will be determined by at least the daily chart. Otherwise you start focusing on the trees and ignore the forest.

You may decide at some point that the SLA is not for you. That's fine. It's not for everyone.

Db

Since I am more interested on SLA and trying my best to be successful without stepping back. Lets see how it goes..
 
Then begin at the beginning, with the weekly.

attachment.php

We can review all the trading opportunities if you like, but, for now, the most recent is the reversal off the lower limit of your channel, around 7125. At this point, you switch to the daily to get a better view of exactly what price is doing and where and when.

The circled area is or was or should have been your area of interest at the time. It's difficult to recreate real time, but if you provide an hourly chart for the circled area, it's at least worth a try.

attachment.php
 

Attachments

  • Insursi6.gif
    Insursi6.gif
    46 KB · Views: 1,507
  • Insursi1b.gif
    Insursi1b.gif
    43.9 KB · Views: 1,546
As it's the middle of the night in Delhi and this shouldn't be torture, I'll do this for you so that we're on the same page. Ask whatever questions you need to ask, and we'll go on from here.

Whether you are or not, you should be short from the red dot. Unless and until your supply line is broken, you stay short.

attachment.php

If you're not short, pretend that you are and have been since the red dot. Even though you may not be in a trade, pretend that you are as you can't enter until the previous trade is exited. This more closely approximates what you'd have to do in reality. You cannot, in other words, go long just because you feel like it. The previous trade affects your decision regardless of whether it was taken or not.

As for the weekly and daily charts, they are important because they got you to where you are. However, until the daily trend channel is approached and perhaps broken, which has already been the case once, it can be set aside. Your immediate concern is what's going on with the hourly. And the hourly as of this chart is currently down. That is your focus. That is the point from which you make your plans. Whatever is going on in smaller intervals is of no concern. Once you're in the trade, leave it alone. Relax until you are called upon to do something. This is the chief advantage of working with longer intervals. Your "timeframe" is one to two months, as that is the portion of the trend channel with which you are working.

Db
 

Attachments

  • Insursi7.gif
    Insursi7.gif
    43.6 KB · Views: 1,483
The futures chart is slightly different.
 

Attachments

  • Insursi7a.gif
    Insursi7a.gif
    17.9 KB · Views: 167
As it's the middle of the night in Delhi and this shouldn't be torture, I'll do this for you so that we're on the same page. Ask whatever questions you need to ask, and we'll go on from here.

Whether you are or not, you should be short from the red dot. Unless and until your supply line is broken, you stay short.


If you're not short, pretend that you are and have been since the red dot. Even though you may not be in a trade, pretend that you are as you can't enter until the previous trade is exited. This more closely approximates what you'd have to do in reality. You cannot, in other words, go long just because you feel like it. The previous trade affects your decision regardless of whether it was taken or not.

As for the weekly and daily charts, they are important because they got you to where you are. However, until the daily trend channel is approached and perhaps broken, which has already been the case once, it can be set aside. Your immediate concern is what's going on with the hourly. And the hourly as of this chart is currently down. That is your focus. That is the point from which you make your plans. Whatever is going on in smaller intervals is of no concern. Once you're in the trade, leave it alone. Relax until you are called upon to do something. This is the chief advantage of working with longer intervals. Your "timeframe" is one to two months, as that is the portion of the trend channel with which you are working.

Db

Thanks dbphoenix for your guidance.

My comfortable bar interval is daily and monthly... as I am recently started trading on derivatives eventhough 2 years active participation on equities (mostly positional and swing).

I feel we review ongoing trend and further on..... instead of reviewing past, so that I can get lot of required information.

Today's action

Daily: If LSL holds, then double bottom - Also near lower TC (looking for long opportunity if it occurs tomorrow) Nifty50 chart

Hourly: RET, Near SL (LSL) - March Future chart (Today is Feb expiry)
I am re-reading all the SLA pdfs....in order to understand some of the basic stuffs related to SLA -LMT approach. Will ask you my doubts after that.
BU8VEjn.png

UrbiDeB.png
 
Thanks dbphoenix for your guidance.

My comfortable bar interval is daily and monthly... as I am recently started trading on derivatives eventhough 2 years active participation on equities (mostly positional and swing).

I feel we review ongoing trend and further on..... instead of reviewing past, so that I can get lot of required information.

You are where you are because of the past. What has happened sets the stage for what will happen. If you don't review the past and you draw your lines incorrectly, as you have done in your first chart, then your guidelines will be wrong and there's no point in drawing them. See post #23. See also that your lines are parallel.

Db
 
I am re-reading all the SLA pdfs....in order to understand some of the basic stuffs related to SLA -LMT approach. Will ask you my doubts after that.

There is only one pdf: click my signature. If you're going by old drafts, you're going to have trouble.

Db
 
You are where you are because of the past. What has happened sets the stage for what will happen. If you don't review the past and you draw your lines incorrectly, as you have done in your first chart, then your guidelines will be wrong and there's no point in drawing them. See post #23. See also that your lines are parallel.

Db

If you want to begin with monthly charts, that's fine. But, again, the past is prologue to the present. The following begins with the change in trend and brings you up to the present. Yes, price has dropped below the lower limit of the trend channel, but until your supply line is broken, there is no reason to exit your short in anticipation of a reversal. There is no way of knowing how far price will drop. The market will tell you when it's time to exit your short.

Db
 

Attachments

  • Insursi8.gif
    Insursi8.gif
    77.4 KB · Views: 193
You are where you are because of the past. What has happened sets the stage for what will happen. If you don't review the past and you draw your lines incorrectly, as you have done in your first chart, then your guidelines will be wrong and there's no point in drawing them. See post #23. See also that your lines are parallel.

Db

Indeed, you are correct. Since, you have already drawn the TC from monthly to hourly. Its clear that yesterday price came below the lower TC channel which means oversold region. I am not anticipating that the trend may change but I should be cautious with my short position. As per hourly chart, supply region is nearly 7000, if buyers overcome, then I have to get out my short position here and will look for next opportunity.
 
I didn't realize until I drew the charts myself that you've posted charts for both the index and the futures. Which are you trading?

Db
 
I didn't realize until I drew the charts myself that you've posted charts for both the index and the futures. Which are you trading?

Db

Future.
For broader view, I always stick with index chart because in future chart we cannot get more than 3-4 months data as it trade only for 3-4 months (particularly in India)
 
Future.
For broader view, I always stick with index chart because in future chart we cannot get more than 3-4 months data as it trade only for 3-4 months (particularly in India)

In that case, your supply line is clearly broken and the first long opportunity should be taken.

Db
 
Occasionally we find a new student who is endeavoring to combine this Instruction with all or part of other ideas and theories (particularly some of the popular, new day "studies" of geometrical chart "patterns") which he has previously acquired. It is sheer folly to suppose that you can hope to discover any easy short cuts to practical market operations. The very nature of the art is such that it cannot be reduced to a basis of rigid formulas functioning along mechanical or mathematical lines. In short, you cannot solve your market problems with a calculating machine. (Wyckoff)
__________________
“Trading to learn” is no more rational nor profitable than playing roulette to learn. (Barber et al)

Db

I am trying to message in the original thread of Wyckoff... but i couldn't

Replying here

PS on my chart, there was moving average print which I was using earlier and I am not using it now though it was appearing when I open the terminal. Sometimes I forgot to remove especially in the morning hours, as I am bit engaged with finding good trades on market hours. Hope you got it.

Why are you using indicators at all?

Db
 
Why are you using indicators at all?

Db

I don't use indicators at all and since I am not at all fan of it. As I said before, few default settings in my terminal since I am new to this terminal. Generally I delete them when I have time but most of the time I don't even care that it presents.

I think, I should learn now... how to use terminal..(removing default settings...)
 
I have two years of active participation in Indian equities as an investor , positional trader/scalping where I used purely candlestick pattern (continuation , reversal, sideways) together with moving average. When I started to participate in derivative market, I am not much comfortable with MA and candlesticks because whenever I see a big red candle on chart - emotionally I close the position by this way I closed many profitable trades at the beginning of the trend itself. These are the reason I am here. Pure line without any color on it makes me feel good on the trade.

I have re-read the SLA pdf and here is short note of it
Before going to the real concept we should understand demand, supply, equilibrium,pace, duration, extent.
(a) assess whether buyers (demand) or sellers (supply) are in charge (price is going up or down) at any given interval, (b) determine how active they are (volume), how quickly price reaches its destination (pace), how far each buying or selling wave goes (extent), how long each of these lasts (duration), where and how and for how long traders come to rest (equilibrium).

Db


1. Determine the current trend of which you trade
2. Determine where to be in at the current trend
3. proper entry
4. Manage the trade- means monitor the trade between buying and selling pressure

SLA works pretty much in trending condition where as for ranging —here comes Wyckoff’s Auction market theory.

1. Find a range
2. Determine where price is —within that range
3. Locate the extremes.
From hereon it's unto traders ability to apply the synergy between the SLA and AMT approach either at real time or at EOD.

Next I come up with review charts—though no trade today because of the budget session in parliament (India)—too much of volatility in Nifty today.
 
Last edited:
Nifty50 update 29th Feb 2016

Nifty50
Weekly and daily : More than a month price is spending much time on lower TC. So I have re-drawn the trend line once again according to the recent price trend.

Hourly: Resistance at 7100, price is trending down, if Price revisits lower TC then good trade with lower risk. Also what I noticed here is that price is trending in a range from 6850 to 7250 range.

DgrbtcU.png
B8pbR59.png

S2tZXqb.png

qVX8FCG.png
 
Back
Top