timsk
Legendary member
- Messages
- 8,834
- Likes
- 3,538
I only posted the above after reading foredog's post, but actually intinded to post an explanation of my earlier comments about inside bars. I wrote this in response to an e-mail, but thought it might be of interest to others . . .
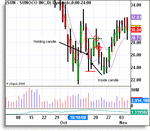
Looking at the attached chart (picked at random):
What I call the 'Holding candle' HC has a high / low of 28.58 and 23.31 respectively. To recap, the HC is the candle whose high and low are outside the high and low of the subsequent inside candle (IC). Without the HC, there is no IC. The gold line is the 5WMA that I mentioned in the earlier post. The purple lines are displaced moving averages based on ATR and provide a visual prompt as to where to take - or not take - a trade. I want to enter as tight as possible to the gold 5WMA, so I won't enter a trade if price is outside the purple lines; i.e. I won't go long if price is above the upper purple line or short if price is below the lower purple line. A long trade is indicated 3 candles after the HC, - the first red circle. (Had price fallen sharply and breached the low of the HC, I wouldn't have gone short as price is outside the lower purple line.) So, I'm long above 28.58 and price moves as expected to start with. However, it pulls back and closes at 28.50, back 'inside' the HC. This is a failed breakout and experience tells me that price is more likely to fall further than it is to rise back up in the direction of the original trade. So, I'd close right there for -8 cents (plus comm's and fills). Very often, when this happens, a good short entry would be the breach of the low of the failed breakout candle - the second circle. Stop placement is discretionary. As a starting point, I generally look to the breach of the other end of the HC. However, in this example, I'd probably have placed it around the low of the 2nd inside candle at 26.00. Please note than this example is poor as it isn't in the context of trend, market sentiment, S/R etc. which, if factored in to the trade, will increase the probability of success. E.g. - note the penultimate candle on the chart that is also a failed breakout candle. Although the HC and two subsequent IC's have highs around 31.60, the round number at 32.00 is just overhead (potential resistance) and price is close to the upper purple line, so it's not a high probability set up. However, had I taken it, I'd have set my stop at the low of the HC at 28.20, but exited when the breakout failed and price closed back inside the HC at 30.59. I'd only have lost $1.00 per share by doing this, instead of a potential $3.00 per share loss if/when price breaches the low of the HC and my stop is triggered.
Tim.


