Scalping_My Way with ACV

SpeedScalper

Junior member
Messages
19
Likes
3
The attached Word document with Charts and Comments....attempts to explain how I use the ACV or Accumulated Volume of the Depth of Market. The ACV is on the Dome of the trading platform that I use. Most trading platforms don't have this available....just check to see if yours has it.


I see a lot of talk in the trade2win forum about Scalping. I have been using this for several years now....on two different trading programs. When I am home....I have my charts and this Dome to trade on....and use it for Scalping....and possible earlier and safer Entries in Trends or Exits from Trends. When I travel....I take my laptop....I usually go to a Starbucks....and trade from the Dome....without looking at charts....just the ACV. You need to be careful doing this....but it can be done relatively safely.


Hope this helps someone.
 

Attachments

  • ACV_04-26-06_trade2win forum thread.doc
    256 KB · Views: 2,620
SpeedScalper said:
Hope this helps someone.
Might well do, certainly an excellent presentation, thanks. Couple of questions, if I may impose further on your time.

Your assumption that the price will move towards the size of orders seems to hold true, and makes sense when the market is moving fast because all the orders on the prices that have just been passed through have been executed. But I find it hard to understand why a trend will start with this set-up. Intuitively I would have thought a lot of sell orders would encourage the price to fall. I accept my intuition is often wrong, but do you have an explanation as to the mechanism of why this works?

The attached doc shows a graphical representation of DOM from Quotetracker, although I've seen similar elsewhere. Would you not see relative volumes at the 5 levels more quickly with this than with ACV only?

Your settings seem to show a stop at 20 pips and a take profit at 2 pips. Is that just an initial setting which you then move to stay in the trend?
thanks Pete
 

Attachments

  • DOM1.doc
    26 KB · Views: 1,069
Last edited:
peto said:
Might well do, certainly an excellent presentation, thanks. Couple of questions, if I may impose further on your time.

Your assumption that the price will move towards the size of orders seems to hold true, and makes sense when the market is moving fast because all the orders on the prices that have just been passed through have been executed. But I find it hard to understand why a trend will start with this set-up. Intuitively I would have thought a lot of sell orders would encourage the price to fall. I accept my intuition is often wrong, but do you have an explanation as to the mechanism of why this works?

The attached doc shows a graphical representation of DOM from Quotetracker, although I've seen similar elsewhere. Would you not see relative volumes at the 5 levels more quickly with this than with ACV only?

Your settings seem to show a stop at 20 pips and a take profit at 2 pips. Is that just an initial setting which you then move to stay in the trend?
thanks Pete
Pete,

1) Think of the Market and Prices like you would Real Estate....it is really similar:

~Buyers in Control of the Market….Property values will usually stay at a Low level or go Down
~Sellers in Control of the Market….Property values will usually stay at a High level or go Up

I wondered the same thing as you....many years ago....but the answer was simple....when you look at it being similar to real estate. Basically....it ends up a being Control issue. And who is Always in Control....the Big Money....and they can make the Market move in what ever direction they want. It is all the Big Money.....Big Contract traders....who are Suddenly deciding to take the Market one way or the other. When they line up like that....with large contracts....they are basically saying.....we are the money.....we will sell to you at a higher price or buy from you at a lower price. If you want to Buy from me....this is what you will pay....if you want to Sell to me....this is what I will pay. This is my opinion only....and it is the only thing I can think of that makes it work this way. But....numbers don't lie....I see this over and over again....so in the end....I don't care why it is this way....I just know it works....and I make money everday....using this ACV. So....I think it is a Control issue more than anything else. If someone has a better explanation....I would like to hear your thoughts.

2) You don't need the Accumulated Volume....if you can calculate in your head fast enough. Not really a calculation....but more of an observation....that the Contracts are building up on one side or the other. On that particular trading platform....I am trying to "convince" the developer to "move" the ACV....to one level across....to spot easier. They are looking at my suggestion....and may have it as a True_False option. Some traders may want to see it....and others won't.

3) that is 20 "ticks"....not "pips"....on the e-mini Russell....with an initial 2 tick target

As my screen name implies....I am a Scalper....so I set-up my "initial" trade as a 2 tick scalp. If the Prices start to move on me....quickly....I "may or may not" try to move my target....to get more ticks. I treat "every trade" as a Scalp trade....until proven otherwise. I am Constantly Challenging the Prices....with Trendlines....Range Boxes....etc.
 
SpeedScalper said:
Pete,

1) I don't care why it is this way....I just know it works
. Fair enough!

2) On that particular trading platform
Did you mean yours, or Quotetracker? I've re-submitted my attached doc (edited first post) because my first attempt failed to show the ACV ratio at the top of the window.

3) that is 20 "ticks"....not "pips"....on the e-mini Russell.
thanks, oops!

I am a Scalper....so I set-up my "initial" trade as a 2 tick scalp.
Thanks for a full and interesting reply. I have been researching the ER2 for much longer than I care to admit. I had narrowed my targets down to 3-5 tick scalps, finding this instrument and these time-frames seemed to suit my personality. Frustratingly though I still have been missing that essential ingredient that would bring my win-lose averages up to an acceptable level which provided a consistent profit. I spent the last 40 minutes of todays market sim-trading looking principally at AVC and was surprised to find it was the most successful part of the day. I am looking forward to tomorrow and the chance to properly begin testing strategies incorporating your methods.
Pete
 
Last edited:
peto said:
. Fair enough!

Did you mean yours, or Quotetracker? I've re-submitted my attached doc (edited first post) because my first attempt failed to show the ACV ratio at the top of the window.

thanks, oops!

Thanks for a full and interesting reply. I have been researching the ER2 for much longer than I care to admit. I had narrowed my targets down to 3-5 tick scalps, finding this instrument and these time-frames seemed to suit my personality. Frustratingly though I still have been missing that essential ingredient that would bring my win-lose averages up to an acceptable level which provided a consistent profit. I spent the last 40 minutes of todays market sim-trading looking principally at AVC and was surprised to find it was the most successful part of the day. I am looking forward to tomorrow and the chance to properly begin testing strategies incorporating your methods.
Pete
Pete,

You can see the same thing on the ES....YM....NQ....EMD....etc.

I looked at your "doc" again....but do not see "ACV"....just the 5 levels....was there supposed to be ACV also. I see at the top....something like "ratio 55:37"....must be it....but doesn't look like it is easy to see. I would like to see Bid 55....Sell 37"....something like that....but it is better than nothing.

I use "Tick" charts only....no minute charts. Why?....because the lowest timeframe you can go on Minute type charts is 1 minute....although some have Seconds....but not many. With Tick charts....I can adjust my Scalping to the speed of the Market. Say....in the morning....if the Market is moving smoothly and with Volume....I use larger Tick charts....say....144 to 377....but if the Market slows down....I can adjust....and very often go down to a 10 or 20 Tick chart....if I decide to trade the slower market. I switched to Tick charts a few years ago. You could do the same thing with Volume charts.

An even better thing to do is....open 4 Depth of Market windows....one for the ES....ER....YM....and NQ. These are the 4 major e-mini's. If you line them up....so you "Only see" the line with the ACV for Bid and Ask....you can have them all together....taking up very little space....and when the ES....ER....YM....and NQ all start building to one side or the other....especially if they get to at least a 2 to 1 spread....then you know....it will more than likely be a Market move....which is Always better than just the ES or ER....etc....moving by themselves. Hope that makes sense.

Good trading to you!

SpeedScalper
 
indexgold said:
This got all the makings of being one of the better threads, thanks to SpeedScalper
Hope it stays on track. If I can....I may change the name of the thread. I will show other things....how I use Time and Sales....Trendlines....Range Boxes....etc. Maybe talk about my methods some....and Discipline....which....for me....is more important than my charts.

It may sound like I look at too many things....but everything is basically "Visual" for me....I don't like to take time to analyze too much. I have found....in the past....I had too many Indicators on my charts....and I would over analyze the hell out of them....then I would make a decision to Enter a trade....would get in....then the Market would go the other way. I am probably the only trader that has had that problem....haha. Now....I keep things as simple as possible. I have a Motto: Discipline plus Simplicity equals Success

Good trading to you!

SpeedScalper
 
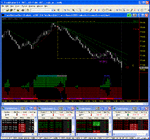
I want to show how I use Time and Sales....with ACV. I have the T&S for the 4 major e-mini's....YM....ES....ER....NQ. You can see the T&S at the bottom of my screen.

For the most part....I don't care about the Contract Size....although I will glance at the ES size when the Prices start moving. Contract size is important....so I do consider it. What I really want to see is....all 4 markets move together....meaning....all go Green or Red....together. And....if I see that....odds are it is a Market move....not just an ES or ER or YM or NQ move. And....Market moves are always better....more likely to see a Trend.

Now....if you have a ACV Dome for each market....the ES....ER....YM....NQ....and you see them all start to build up on the Buy side or Sell side....and then Glance at the T&S....to see if the Color....indicates the same....then the odds are good....we could have a Trend develop. In both instances....we just want to be able to do a Visual....on the ACV and T&S. We do not want to have to analyze the hell out of everything....because....you can miss good trades or Enter or Exit a trade too late.

So....in the Yellow box....at the start of the Down Trend....if you see the ACV and T&S indicating the same thing....you can enjoy the ride down. This is all based on Price Action. If you have an Indicator....these two things will help confirm the Indicator. ACV and T&S....a Visual look....is really powerful. The important thing here is....do not over analyze what you see....again....just my opinion.

The picture is saved as a GIF....but it doesn't show everthing correctly....cutting off some things.

SpeedScalper
 

Attachments

  • er_234 tick chart_04-27-06_2.GIF
    er_234 tick chart_04-27-06_2.GIF
    81.5 KB · Views: 1,540
Last edited:
I sim-traded the er2 yesterday borrowing on your ideas. I bled cash rapidly for the first hour whilst leaning heavily on the ACV, then re-gained most of it using T&S for confirmation on the 4 majors. That stopped me entering on several occasions where the ACV suggested a sell, but T&S was a sea of green. Had some trouble with controlling losses, I usually use a very tight stop and the disaster stop 20 points away meant I had to manually kill trades that looked like they were going astray, which I often did too late. I assume you stop out a trade when your entry criteria no longer hold?
What is the indicator that looks like a red and green matrix or jigsaw pieces half way up your attachment?
 
peto said:
I sim-traded the er2 yesterday borrowing on your ideas. I bled cash rapidly for the first hour whilst leaning heavily on the ACV, then re-gained most of it using T&S for confirmation on the 4 majors. That stopped me entering on several occasions where the ACV suggested a sell, but T&S was a sea of green. Had some trouble with controlling losses, I usually use a very tight stop and the disaster stop 20 points away meant I had to manually kill trades that looked like they were going astray, which I often did too late. I assume you stop out a trade when your entry criteria no longer hold?
What is the indicator that looks like a red and green matrix or jigsaw pieces half way up your attachment?
peto,

I have to apologize. I should say to everyone....please do not trade this with Real Money....unless you feel very comfortable with doing so. Also....I believe I mentioned....but not sure....when I travel....I trade with the ACV only....without charts....because there is not enough room on my laptop screen to see the charts and ACV. But....I have been doing this for years....and since this is my method....I am probably used to reading it better than someone who has seen it for the first time. I am just trying to show how I trade. I did not start this thread to help you blow your account....I started it to help....give you another "tool" to use. So....please use your charts and your favorite indicators with this method.

Reading your Candles or Bars is very important. I will "work the individual Candle"....meaning....if I see the ACV....building up faster to one side....and I think the Price is going to move....let's say Up....I will watch the Candle....try to enter with a Market order....on a "pullback"...."within the Candle"....so I can get less slippage....or no slippage at all. Often....I am in and out on the same Candle. I treat every trade as a Scalp trade....unless the Price Action proves to me it is going into a Trend.

This is what I do:

ER = $10 per Tick with 10 ticks per Point = $100 per Point
Strategy is:
2 ticks = $20 * 4 contracts = $80 per trade Gross
RT commissions = $3.90 per contract * 4 contracts = $63.40 Net Proit
Say your Net Daily Goal is $250 per day....you need to do this $63.40 trade......4 times....to reach your goal.

Have to go somewhere right now....but will finish answering questions when I get back.

SpeedScalper
 
Last edited:
SpeedScalper said:
peto,

I have to apologize. I should say to everyone....please do not trade this with Real Money....unless you feel very comfortable with doing so.

SpeedScalper
Don't panic I'm using Bracket Trader in 'Simulator mode' attached to a live Interactive Brokers Platform, until I have a profitable system sorted out. The rules used by BT for fills and slippage are not fully realistic so I would eventualy move to live trading cautiously to continue testing (with one contract at a time); but not for some time yet!

One limitation of IB's feed is that only 2 DOM windows are permitted, otherwise I can replicate your set-up reasonably accurately. Thanks for your further info, I have also researched some of your stuff on Elete, and found a partial answer (posted yesterday) to my earlier question about the unusual indicator on your attachment.
p
 
Last edited:
peto said:
Don't panic I'm using Bracket Trader in 'Simulator mode' attached to a live Interactive Brokers Platform, until I have a profitable system sorted out. The rules used by BT for fills and slippage are not fully realistic so I would eventualy move to live trading cautiously to continue testing (with one contract at a time); but not for some time yet!

One limitation of IB's feed is that only 2 DOM windows are permitted, otherwise I can replicate your set-up reasonably accurately. Thanks for your further info, I have also researched some of your stuff on Elete, and found a partial answer (posted yesterday) to my earlier question about the unusual indicator on your attachment.
p
I have never used IB....although I know many traders who do.

I have programmed many indicators over the years. There is specific information that I want from my indicators. I just found a way to put it all in one indicator....which helps keep my chart relatively uncluttered.

Basically....without revealing any programming code....which is somewhat complicated....the Green and Red dots....can often give me an early indication of when Prices are getting ready to turn. This can really help....especially if you are a Scalper like me. Scalpers have to be able to "react" much faster than Trend traders.

I won't give this indicator away....but I may give some others away at some point.or may even help others if they are having a problem programming their own. I don't have a lot of extra time....especially when my lady is home....she always has something for me to do. Sometimes....when I look at all the indicators I have made....probably over a hundred....I wonder....I got into trading....to have some Independence....yet I spend so much time programming....do I really have independence....haha.

All my indicators are on TradeStation. I am working on programming my indicators for NinjaTrader....to ad them to their charts. I live very close to the Microsoft campus in Redmond, Washington....near Seattle....and I have a friend who was a Project Mangager at Microsoft....and he has a several programming friends from Microsoft who are helping me convert the code....so I can add the indicators to NinjaTrader. Damn....it's nice to have friends....especially smart programming friends....haha

SpeedScalper
 
Hi SpeedScalper,

Thanks for starting this great thread..

Collecting 2 ticks every time sounds like a good plan but how do you avoid the S/L from being hit too often? Do you use time limits or do you just exit as soon as the signal that made you enter the trade is no longer there?
I try scalping for some time now but still did not find a good way to limit the losses... (many good trades followed by one S/L being hit and I am back to square one again... and again... ) :eek:

Thanks,
fxquest
 
fxquest said:
Hi SpeedScalper,

Thanks for starting this great thread..

Collecting 2 ticks every time sounds like a good plan but how do you avoid the S/L from being hit too often? Do you use time limits or do you just exit as soon as the signal that made you enter the trade is no longer there?
I try scalping for some time now but still did not find a good way to limit the losses... (many good trades followed by one S/L being hit and I am back to square one again... and again... ) :eek:

Thanks,
fxquest
fxquest,

Most of my trades last from about 10 seconds to 30 seconds....somtimes....depending on what I see on the charts or ACV....I may stay in the trade longer. If I do not have my 2 ticks by 40 to 50 seconds....I usually get out....or back it off to one tick target. The real key to getting 2 ticks....or any amount of ticks....is the Entry. If I read the ACV correctly....and my chart correctly....I will get my 2 ticks. Also....if I see the Price starting to Trend....I will stay in longer....but I have to be convinced first....that a Trend is developing.

Stops....can be a big problem. That is why I have Specific and Strict Rules that I follow....for every trade I Enter. For several years now....I have been using J-Trader for my trading....and I have Never set a Stop. I do not recommend this to any trader. I still use J-Trader....but have been trading more with NinjaTrader now....and with Ninja....I do set a Stop. The problem with Stops....if you set it to close....you will get taken out of a trade....even if you are going in the right direction....and if it is not close enough....you can lose big. I use Tick charts....and depending on the Tick chart....I decide where to set the Stop. What I would recommend....whatever type of chart you use....look at a lot of the Candles or Bars....and try to see what the Average Price Range is. For instance....say you are using a One Minute chart on the ES....if the Average Price Range for the Candles is 4 ticks....then set your Stop....greater than 4 ticks. This is something only you can figure out. There will be some candles that are 2 ticks....some that may be 6 ticks. This is just an example.

SpeedScalper
 
Excellent thread SS, thanks for sharing your insights

peto said:
One limitation of IB's feed is that only 2 DOM windows are permitted
p

You might want to try this again peto, I can get 3 DOM windows, so IB must have changed something recently.
 
MGBRoadster said:
Excellent thread SS, thanks for sharing your insights
You might want to try this again peto, I can get 3 DOM windows, so IB must have changed something recently.
You are quite correct, thank you.
I have moved my front-end to Buttontrader, amongst other advantages is a graphical representation of the number of bids/ offers at each of the 5 levels as well as the ACV, each one is shown as a bar, stacked above or below the others.
 
I may have put these Word docs into another thread....but decided to consolidate into this thread. Hope they help someone in some way.

Bill
(in beautiful Seattle)
SpeedScalper
 

Attachments

  • Data Based Indicators for Trading.doc
    45.5 KB · Views: 793
  • E-mini Points.doc
    40.5 KB · Views: 693
  • Entry_Exit Log.doc
    270.5 KB · Views: 748
  • Key Reversal Times.doc
    23.5 KB · Views: 676
  • Your Written Goals with Example.doc
    30 KB · Views: 667
  • Attitude Is Everything.doc
    27.5 KB · Views: 713
SpeedScalper said:
I may have put these Word docs into another thread....but decided to consolidate into this thread. Hope they help someone in some way.

Bill
(in beautiful Seattle)
SpeedScalper

Hi Bill

Thankx for this - most generous!

I have some thoughts on all of above and will post later.
 
Hi Speedscalper,

Thanks a lot.

I've been trying to use the ACV for stocks and have some queries. Appreciate your advise.

1) Many times the ACV imbalance is more than 2:1. For example it could be ACV for bid side is 5 times that of the ask side. Is it still then that the price will go down or will you assume that there is massive support at the buy side and thus not short the stock. Rather one will end up buying the stock?


2) The ACV many times change extremely fast. For example, the ACV for bid side will be 2x that of ask side. However, in the next few seconds, it will be the opposite (ACV for ask side is now 2x that of bid side). Or it could be that now the ACV for both bid and ask sides are roughly equal. Do you consider this all noise or what?

3) How long will you wait to enter a trade when you notice the ACV imbalance? For example, when you notice that the ACV for bid side is around 2x that of ask side, do you enter immediately or do you wait for the imbalance to last for a certain amount of time before entering?

4) If you enter a trade (bought the stock) due to the ACV on ask side being 2x larger than the bid side, will you exit immediately if the ACV suddenly changes and now the ACV for bid side is now much larger than ask side?

Appreciate your advise. Thanks
 
billp - I was under the impression that SpeedScalper uses ACV for emini index futures, usualy the ER2. I was not aware he traded stocks. Nevertheless I would be interested to hear his reply in so far as your questions are relevant to the ER2.
SS, thanks for your latest contribution...
 
Top