firewalker99 said:Hope you don't mind me saying, but it would think it's safer to start all trendlines from the same point of origin. In this case, the highest point near the top of the chart above 130.2...
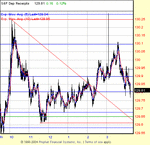
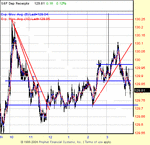
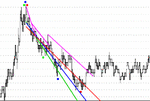
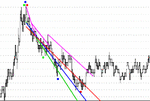
I most definitely do not mind you saying what you did. Let me run the thought process I used to generate those lines by you. As I mentioned in a very early post on the P(V) thread, I believe that the Victor Sperandeo protocol for drawing trend lines is the best and it is outlined in both of his books (just google his name and you'll get the titles of the books - good stuff if I might say). Briefly put: beginning at a swing high, draw the line from that point through the point which is the highest high before the next swing low without passing through any other lines. You will excuse the rather liberal use of the term "swing" but it is meant in a more time-constrained manner than its usual sense. What I did then was to shift the starting point for the trend line whenever a support area was broken, thereby generating a new line while remaining rigorously faithful to Sperandeo's rule. How does that old song go "Call me anal-retentive, call me ...."?
Db clearly agrees with your point and while I am not trying to form a heretical sect and well appreciate that he (db) has talked about how he draws these lines, I thought it was interesting to see how price played out when in the vicinity of these lines. It is very true that any interaction between price and the line may be more apparent than real but trend lines do appear to be useful for at the least, alerting one to a possible change in the mood of price.
ljey


