Risk Reward Myth

Hi Atilla,
An interesting test - well done for committing the time and effort into doing it.
(y)

One variable that will impact the result of the 50 trade sample is your decision as to when to place trades. Looking at the 2 charts you've posted above, based on my (mis?)understanding of your comments thus far, I was expecting to see an 'obvious' BB squeeze. Leaving aside (for the time being at least) what constitutes an obvious BB - to my way of thinking neither of the two pending trades qualify. The bands aren't anywhere near tight enough. For the benefit of subscribers to the thread who aren't aware of the significance of this, broadly speaking, the tighter/narrower the period of consolidation (i.e. the tighter the BB squeeze) - the more explosive the breakout is likely to be when it occurs. In other words, the more selective one is with the BB squeeze, the greater the probability of the 2:1 profit objective being achieved.

I think the test would be more interesting and more likely to produce a higher success ratio if the BB squeeze was defined as being say less than 50% of the ATR from X periods ago. The smaller the %age the better but, of course, that will impact the number of trades and the length of the experiment.

Let me know if this isn't clear and I'll rustle up some charts to illustrate what I'm banging on about!
Tim.


Hi Tim,
Yes agreed and excellent observation and very valid points. However, time is the big factor and I have very little of it. What you say is very true and would be fantastic to carry out a statistical study of it but not at this moment in time.

Looking back to evaluate (crude form of backward testing) this approach there were two other locations where BBs narrowed each consisting of different range and time period.

Point 1 - I think would have entailed both entry orders being hit but the short would have been successful and the long failed.

Point 2 - I don't think would have been hit on the long (but depends on where entry is made) but the short would definately once again have returned monies.


Whilst what you suggest is true - in all honesty sometimes I feel a quick 30-60 seconds glance is all it takes. I think they are easier to catch on the 15min charts but usually start with the Weeklies and drill down.

Addenda: you could call it a rush trade. I wanted to get couple in but whilst it would be better the narrower the bands are there is the possibility both trade being hit. As in point 1.


If anybody else has time to indulge and develop these ideas I'd be grateful and very interested to observe. For my purposes it suits the bill.


I notice this R&R two trades returned positive results today whilst my Week #5 market orders are down $500...

https://www.forexdesk.com/traders/Atilla/accounts/193


Finally - the temptation to close these trades in profit is so great in live trading I would have locked the profits - scaled down or applied trailing SL.

So far so good today. 2 in profit and 1 more positive trade. 7 down 43 more trades to go. No rush... :whistling
 

Attachments

  • R1R2-EURUSD-20110613-b.jpg
    R1R2-EURUSD-20110613-b.jpg
    200.7 KB · Views: 308
Last edited:
If anybody else has time to indulge and develop these ideas I'd be grateful and very interested to observe.

I traded a similar method some years ago with some success. It you want to trade bollinger squeeze type set-ups, it might be worth checking out Phillipe Cahens book Dymamic Technical Analysis of Financial Markets (DTAFM). Its one of the few trading books I actually reccommend (the second version which unfortnately was published only in french is the preferred version). In fact, anyone utilising bollinger bands in their trade sets ups could probably benefit from a read.

Mr Cahen also occasionally posts on a couple of french trading forums, and the quality of dialog is generally high.
 
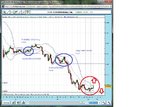
Here's another...


USD/JPY 13/06/2011 22:36:05 sell 1 80.15000

USD/JPY 13/06/2011 22:34:12 buy 1 80.25000


(y)
 

Attachments

  • R1R2-USDJPY-20110613-c.jpg
    R1R2-USDJPY-20110613-c.jpg
    149.8 KB · Views: 310
Tonights bait is the AUDUSD

https://www.forexdesk.com/traders/Atilla/accounts/193

AUD/USD Stop Entry 15/06/2011 00:01:43 buy 1 1.06950 waiting

AUD/USD Stop Entry 14/06/2011 23:55:54 sell 1 1.06750 waiting


Personnaly I could never have held onto USDJPY currently up $696 this long. I'm learning something about my psychie here.

I think R1:R2 is good as target for starters but trade management is absolutely essential to state the obvious. If that turns to a loss I'd be kicking my self off the walls... Thus; to complement this system; 1-Trailing SL, 2, Break Even adjustment or scaling out & profit taking is a must. To keep things simple all trades are in 1 lots.


Another observation today was in competition week #4, a previous Entry Order got hit and closed up for +52 pips @$618 on 2 lots.

Basically - because BB emphasise congestion and decision point after big moves and true to text book style - previous Resistance becomes Support and vice-er-visa these points likely to be major reversal or decision points.

I would normally close the opposing trade when one side gets hit but I'm now considering leaving both on.


Finally - both USDJPY trades got taken out at 03:00 in the morning. Because it was based on small time frames and narrow BBs only 10 pips was lost to each side.

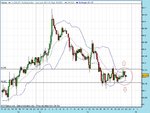
I was also aware of the CandleSticks with the long tails that portrude outside of the BBs. I never like these really and so I've place triangles to alert one to danges of high volatility and inconsistent opinions in the market place.


Finally 2 - I've circled in blue looking back in hindsight - alternative locations where I may have considered going in based on BB breakouts after narrowing.

I think point 3 is a no no but locations 1 & 2 would have returned pips with some early intervention.

I hope this makes sense and I can see how formulating stronger rules in terms of time and range can avoid some of these loose trades from being entered into and subsequently failing.


Over all so far so good - 9 trades down 41 to go. Encouraging results and accounts well in profit without any intervention.

I've also decided to go back to my books to swat up further on BB to see if I can add more depth and flesh to this system. May pick your brains in due course Tim...(y)
 

Attachments

  • R1R2-AUDUSD-20110614-1.jpg
    R1R2-AUDUSD-20110614-1.jpg
    150.3 KB · Views: 289
pin bar - 86 pips
3 x risk = 258 pips


Thanks RogueTrader,

Sticking to R1:R2 rule - I've placed a similar pair of entries based on 1hour charts


GBP/USD Stop Entry 15/06/2011 01:22:06 buy 1 1.64200 waiting

GBP/USD Stop Entry 15/06/2011 01:21:05 sell 1 1.63600 waiting

600:1200
 
Thanks RogueTrader,

Sticking to R1:R2 rule - I've placed a similar pair of entries based on 1hour charts


GBP/USD Stop Entry 15/06/2011 01:22:06 buy 1 1.64200 waiting

GBP/USD Stop Entry 15/06/2011 01:21:05 sell 1 1.63600 waiting

600:1200


i hope im not swinging for the fences, but ill give it a go like
 
i hope im not swinging for the fences, but ill give it a go like


Good call RogueTrader. The GBPUSD sell has taken the bait along with the EURUSD.

https://www.forexdesk.com/traders/Atilla/accounts/193


This demo account I think will instill discipline in me not to close account prematurely... (y)


I'm now thinking to really test the system setting up three demo accs:

1:1
1:2
1:3

Apply identical entry order trades to all and see which performs over a period of few months.

Time pending... :whistling
 
Wow - USDJPY closed up with a nice return.

GBPUSD also a big hit.

This automated entry order account with R1:R2 is proving to be a bigger hit than my manual trading.

Well there goes my psychology as to how useless it is.

We are over the 20% mark - 11 trades completed, 1 in profit at the mo - with 37 more trades to go.


RogueTrader that was a fantastic trade last night. 120pips - Good one matey. (y)


thanks fella, alls good, thats (hopefully) what were all here for like (y)
i still feel the psychological aspect is the most overlooked and hardest thing to master (well it always has been 4 me) ha - also i dunno why exactly ? - but i always seem to take bigger risks when the sun is shining, thats crazy i know ha - maybe any psychologists on the site can tell me :p
 
Good call RogueTrader. The GBPUSD sell has taken the bait along with the EURUSD.

https://www.forexdesk.com/traders/Atilla/accounts/193


This demo account I think will instill discipline in me not to close account prematurely... (y)


I'm now thinking to really test the system setting up three demo accs:

1:1
1:2
1:3

Apply identical entry order trades to all and see which performs over a period of few months.

Time pending... :whistling

ive come off at R2 before now & its gone to R5 - very rarely, but makes ya wanna practice your karate skills on the computer no end :LOL:
 
ive come off at R2 before now & its gone to R5 - very rarely, but makes ya wanna practice your karate skills on the computer no end :LOL:

Hi RogueTrader,

I can only see a R1-R2 return but I suspect your Risk was less and thus 5xR.

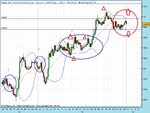
Here is the chart I saw on the one hour TF on which I placed two entry orders. This was around 01:20 hours.

Using backward testing - I would guess at point 1 - both trades would have been activated but after reversal would have +ve return.

Point 2 would also have delivered a +ve return. R is considerably higher but so is the return.


This supports my MA price crossover system too but placing two trades to both sides totally removes psychological issue. R1:R2 also removes the big IF should I or not.

I did angst over that USDJPY trade and if not for this demo account and adhering to the rules - there is no way I would have let that trade run for so long.


I think - I'm having problems with my maths and probably don't have a future in trading... :eek: As it stands 11 down 39 to go... Where did 37 come from???
 

Attachments

  • R1R2-GBPUSD-20110615-1.jpg
    R1R2-GBPUSD-20110615-1.jpg
    109.9 KB · Views: 249
Hi guys,

Whilst dabblng with the Atilla#5 account I placed entry into the RiskReward account.

Really sorry about this. closed trades as soon as I discovered error - no Stops or Limits... Honest mistake... :eek::eek::eek:

We'll have to scratch this from the stats...
 

Attachments

  • Mistake.jpg
    Mistake.jpg
    36.7 KB · Views: 230
May pick your brains in due course Tim...
Pick away Atilla - although I fear you'll be disappointed. You seem to be doing just fine on your own!

When it comes to free stuff on the net, this site is about the best I've found (which ain't saying much!) on Bolly bands:
BB Genius by Mark Deaton
His YouTube video is worth a look too. However - be warned - if you sign up for the workbook and videos, your inbox gets spammed to hell with the usual 'this $97.00 e-book will make you squillions' nonsense.
Tim.

Cheers Tim and thank you for the heads up too. I've had a quick look already.

I was thinking with all these indicators there is a bias to pick direction and ensure right one is picked. I'm not so much interested in the signal as dual trades are entered similtaneously. More as you put it what defines a BB in terms of numbers (length width contraction etc) and corresponding breakout.

Systems' key issues for me are;
1. Where to place the buy and sell entry orders
2. Where to place Stops -> usually other side of BB.

3. 1+2 -> determines risk
4. 3 -> determines limit=reward.


Thus far system is very much a visual one. The only numbers I have are the R:R.

Questions I can think are;

1. What constitutes a BB?
a) Time Frame Length - no of Clandlesticks
b) Time Frame - Days - Hours - Mins
c) What % of the BB to place entries above and below
d) Volatility - measured in terms distance for the length and width of the BB
e) % contraction
f) Subsequent breakouts as a % of BB

The more I think about it the more complex and deeper the system becomes.

Am I on the right tracks here or do you or anyone have alternative views re: BBs?

Hence - the visual inspection - rounding up seems to be the way forward at the mo. Best times for visual inspection seem to be to sit down with coffee late at night when it is all quiet place the trades and then forget about them.

As mentioned very surprised and delighted about the NO intervention discovery... :)
 
Questions I can think are;

1. What constitutes a BB?
a) Time Frame Length - no of Clandlesticks
b) Time Frame - Days - Hours - Mins
c) What % of the BB to place entries above and below
d) Volatility - measured in terms distance for the length and width of the BB
e) % contraction
f) Subsequent breakouts as a % of BB

Hi Atilla,
1. Did you mean 'what constitutes a BB squeeze? If so, I'd say something based around a contraction from their 'normal state. I'd define normal as the typical distance apart when the instrument is rangebound on decent volatility.
a) Because BBs are volatility based, I don't think you need to worry about this. Once you've established that volatility is very low and price is contained within a narrow range - that's all that matters. Sooner or later price will break out, regardless of whether the period of contraction has lasted for 5 candlesticks or 20.
b) Again, I don't think this matters. The basic principle should apply equally to all timeframes, IMO.
c) Much harder! The anti-indicator lobby will be shocked at this suggestion, but there is an argument for letting the BBs themselves trigger a trade entry, based upon their expansion. This might help avoid false entries based on price braking out of the bands and then swiftly retreating back inside them. Achieving this in practice might require some clever programming skills though?
d) IMO, only worry about the width (top to bottom) of the BB, I don't see that the length (left to right) as being a key factor. Others may disagree?
e) This is important because I suspect you'll find through testing that the tighter the contraction, i.e. the smaller the %age of the 'normal' BB state - the bigger the subsequent move. So, the potential reward is bigger and the risk is smaller - if stops are placed at the opposing band for example.
f) Kind of addressed this above in e).

Just to add to c) a bit more . . .
One of the benefits of indicators that are computed over a number of periods (usually 20 is the default setting with BBs), is that they are lagging! A one-off candle spiking through the BBs won't have much (any?) effect on the bands themselves. Sustained momentum over a number of periods is required to get a sharp move (up or down) in the actual BBs. So, if one enters when the bands - rather than price - have started to expand, one should reduce the number of false signals. Critics will point out - quite rightly - that one risks entering a move late - possibly when it's too late. Getting the balance right could be tricky. This is all theory on my part, I've done no testing to support it and it could be a load of hogwash! (No change there then Tim!)
Tim.
 
hi roguetrader,

i can only see a r1-r2 return but i suspect your risk was less and thus 5xr.

Here is the chart i saw on the one hour tf on which i placed two entry orders. This was around 01:20 hours.

Using backward testing - i would guess at point 1 - both trades would have been activated but after reversal would have +ve return.

Point 2 would also have delivered a +ve return. R is considerably higher but so is the return.


This supports my ma price crossover system too but placing two trades to both sides totally removes psychological issue. R1:r2 also removes the big if should i or not.

I did angst over that usdjpy trade and if not for this demo account and adhering to the rules - there is no way i would have let that trade run for so long.


I think - i'm having problems with my maths and probably don't have a future in trading... :eek: as it stands 11 down 39 to go... Where did 37 come from???


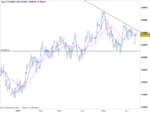
r3
 

Attachments

  • cable - R3.png
    cable - R3.png
    15.7 KB · Views: 285
Top