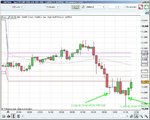
I've played around with the IG Advance charts and came up with this. Anyone with more knowledge and experience of the C-Pivot care to comment? I am not sure about the interpretation.
The blues are the R1,R2 and R3, the magenta is the Pivot and the reds are S1, S2 and S3. The dotted is the usual MA. Also the lines are calc'd on the bid price - as the chart has built in functions for the daily close, high and low, I suspect that its based on the mid price
If you are going to use pivots I suggest you plot the weekly pivots, not the daily pivots. You calculate these by using the open, high, low and close of the previous week instead of the previous day.
Having said that I see 2 trades on the chart you posted, see attached, the second one is doing very well as we speak

