Re - EUR USD 30M chart

Daily chart below...the fibs are the unbreeched fibs of the daily/weekly swings up from 1.1875 and 1.2584 (yellow and grey respectively) and the daily swing 1.2148 (orange) all to that 4285 Hi. The dotted line fib extensions are of that last daily HL-H. These and the previous near-term fractal swing hi/lo's as well as the ascending trend line are as I see it, the near-term most obvious potential support/rbs factors on this t/f.

G/L


Last edited:
I think we're heading to 1.2650-ish with maybe a pull back to retest 1.3200 first - If 1.3200 is broken then around 1.3350 is a possibility but if we keep below 1.3500 then I'm staying short and will add to my position as\if it pulls back to each of those levels.
 
Why, and over what timescale?

Time scale... Weeks to months I guess but this is the next area of major support I see. Assuming the down trend continues then this is my target but then it could turn at any point and my opinion will change so we'll see. What I posted is my current view and plan.
 
Time scale... Weeks to months I guess but this is the next area of major support I see. Assuming the down trend continues then this is my target but then it could turn at any point and my opinion will change so we'll see. What I posted is my current view and plan.

200ma off the daily worth keeping a weather eye on imho...
 
200ma off the daily worth keeping a weather eye on imho...

I don't really bother with ma's but just had a quick look - Do you think it will act as support now? Not sure how I should view it, I mean, price can move through the average and miles away so what significance does it hold? What would you be looking for with the 200? Sorry if it's a daft question, just not something I've looked at.
 
I don't really bother with ma's but just had a quick look - Do you think it will act as support now? Not sure how I should view it, I mean, price can move through the average and miles away so what significance does it hold? What would you be looking for with the 200? Sorry if it's a daft question, just not something I've looked at.

Well shoot me down in flames if I am wrong but I think the 200 sma is used by many traders including institutions as a gauge for a solid value for the long term trend it therefore could come into play as substantial S/R.

I am definitely standing aside in this market until a clear trend develops, there are some numbers out at 3pm so hopefully this will kick start things.
 
looking for support at 3050. wait for double wave to form. then go long.


Hi Zaxkjcr

Can you shed any more light on your double wave theory, is this some sort of stochastic you are using?

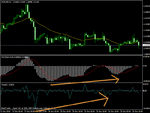
I can see bullish divergence in the macd and force index on the 1H chart (see attached) and this is into a daily downtrend, another reason for standing aside so the market can sort this one out.
 

Attachments

  • eur usd.gif
    eur usd.gif
    17.3 KB · Views: 145
I don't really bother with ma's but just had a quick look - Do you think it will act as support now? Not sure how I should view it, I mean, price can move through the average and miles away so what significance does it hold? What would you be looking for with the 200? Sorry if it's a daft question, just not something I've looked at.

Hi Liam, as you know by now for me it's support & resistance ( 3 levels), the pivot, HH & LL of the session, volume (tricky to gauge with FX) and news events *and big looming round and crucial numbers. You have to think what the market makers and movers might *use* to make decisions, we're playing in a Sunday pub league, you have to keep a weather eye on what they're doing in the premiership.
 
Last edited by a moderator:
Top