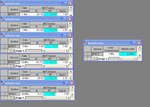
Program Trading: Trade Entry

Thanks Paul I was finding the same thing. However, I did notice that it seems very accurate with its turning points from both the 2.00 & -2.00 levels on the 10min chart.

Have you found that? I'm going to back test the Fisher RVI exclusively on the 10 min chart and see what results I can dig up.

Naeem

I will have a look today as well.


Paul
 
Sample testbed setup

Here are the two chunks of TS2000i code for testing the MACCI-653 in the way I've described.

The first chunk contains the Indicator and the extra code detect the signal to output it to a GV.
Lines highlighted in Blue are effectively the original code for the indicator.
Lines highlighted in Red are the additional lines of code added to grab the signal and output it to a globalvariable.

The second chunk picks up all the GV's and analyses them looking for a composite signal.
Note to programmers, I haven't bothered checking the Error code status's. It all seems to work well enough without that. Also the way T2W appears to treats spaces in a post means that the first Print line in the second chunk doesn't line up with the data in the second print line. This won't happen using proper ELS code. I posted this way to highlight things using colours


CHUNK 1:-

inputs:

Length1(6),
Length2(5),
Length3(3);

Vars: CCIval(0), CCIavg(0), MACCI( 0 ), MacciT(0), RtnVal( 0 ),SIGNAL(0) ;

CCIval = CCI(Length1);
MACCI = average(CCIval, Length2);
MACCIT = average(CCIval, Length3); {MACCIT is the Trigger line}


If MACCI >80 then begin
If MACCIT < MACCI then Signal = 2
else Signal = 0 ;
End;
If MACCI < -80 then begin
If MACCIT > MACCI then Signal = 1
else Signal = 0;
End;
If MACCI < 80 and MACCI > -80 then begin
If MACCIT > MACCI then Signal = 1
else begin If MACCIT < MACCI then Signal = 2;
End; end;


if RtnVal >= 0 then
Plot1( MACCI, "1m" ) ;
Plot2(MACCIT,"MT");

Plot3(Signal,"Signal");

If Signal = 2 then begin
RtnVal = GVSetNamedFloat( GetSymbolName + "76", SIGNAL );
end;

{COMMENT - GetSymbolName + "76", is the Globalvariable name for this timeframe i.e. 60 mins. For other timeframes it will be different as can be seen in the second chunk of code below.

If Signal = 1 then begin
RtnVal = GVSetNamedFloat( GetSymbolName + "76", SIGNAL );
end;
If Signal = 0 then begin
{RtnVal = GVSetNamedFloat( GetSymbolName + "76", SIGNAL );
end;


Value1 = Ticks ; { Force RadarScreen to update every tick. }

------------------------------------------

CHUNK 2 (this code is the same for all tests) :-

inputs:
ErrorCode1( -1 ) ,
ErrorCode2( -1 ) ,
ErrorCode3( -1 ),
ErrorCode4( -1 ) ,
ErrorCode5( -1 ) ,
ErrorCode6( -1 ) ;
variables:
RtnVal1( 0 ) ,
RtnVal2( 0 ) ,
RtnVal3( 0 ) ,
RtnVal4( 0 ) ,
RtnVal5( 0 ) ,
RtnVal6( 0 ) ,
Message( "" ),
Signal(0);
if LastBarOnChart then begin
RtnVal1 = GVGetNamedFloat( GetSymbolName + "71", ErrorCode1 ) ; {60 mim}
RtnVal2 = GVGetNamedFloat( GetSymbolName + "72", ErrorCode2 ) ; {30 min}
RtnVal3 = GVGetNamedFloat( GetSymbolName + "73", ErrorCode3 ) ; {10 min}
RtnVal4 = GVGetNamedFloat( GetSymbolName + "74", ErrorCode3 ) ; {5 min}
RtnVal5 = GVGetNamedFloat( GetSymbolName + "75", ErrorCode3 ) ; {3 min}
RtnVal6 = GVGetNamedFloat( GetSymbolName + "76", ErrorCode3 ) ; {1 min}
end;
{Market Long or Short ?}
Condition1 = (Rtnval3 = 1 and Rtnval2 = 1) OR (Rtnval3 = 1 and Rtnval1 = 1); {10 and 60or30 Long}
Condition2 = (Rtnval3 = 2 and Rtnval2 = 2) OR (Rtnval3 = 2 and Rtnval1 = 2); {10 and 60or30 Short}

{Entry Long or Short ?}
Condition3 = (Rtnval6 = 1 and Rtnval5 = 1) OR (Rtnval6 = 1 and Rtnval4 = 1); {1 and 3or5 Long}
Condition4 = (Rtnval6 = 2 and Rtnval5 = 2) OR (Rtnval6 = 2 and Rtnval4 = 2); {1 and 3or5 Short}
Plot1(" ","Alert");
If Condition1 and Condition3 then begin

Plot1("LONG ","Alert");
SetPlotBgColor(1, cyan);
Print(Playsound("C:\sierrachart\alertsound2.wav"));
Print(Date,Time," 60"," 30"," 10"," 5"," 3"," 1"," LONG");
Print(Date,Time," ",Rtnval1," ",rtnval2," ",rtnval3," ",rtnval4," ",rtnval5," ",rtnval6,"LONG");
end;

If Condition3 and Condition4 then begin

Plot1("SHORT ","Alert");
SetPlotBgColor(1, Red);
Print(Playsound("C:\sierrachart\alertsound2.wav"));

{COMMENT - the line of code above plays a sound file when a composite signal is detected. It can be removed or altered to use a sound file from your own PC}

Print(Date,Time," 60"," 30"," 10"," 5"," 3"," 1"," SHORT");
Print(Date,Time," ",Rtnval1," ",rtnval2," ",rtnval3," ",rtnval4," ",rtnval5," ",rtnval6,"SHORT");
End;
Value1 = Ticks ; { Force RadarScreen to update every tick. }
 
Last edited:
Looking at the code in #TT_MTL_CYCLE3, there's mention of adding oscillator turn code. Some functions along those lines.

TT_Cycle_Turn:
// Pass back an indication on whether the Cycle (oscillator) has turned.
// Returns:
// -1 - Turned downwards
// 1 - Turned upwards
// 0 - No turn

This indicates on the current/last bar.

A variation is to pick up which bar in the past, within a given interval, the oscillator turns.
TT_Cycle_Turn_Bar:
// Returns how many bars ago the cycle turn occurred.
// Parameters:
// Cycle - Oscillator value, e.g. from TTCycle.
// NBars - Number of bars to search for cycle turn.
// Return value is how bars ago the turn occurred.
// It is negative for downturns, positive for upturns
// and zero if no turn was found within NBars.


Included: test indicator #TT_OscTurn and an amended #TT_MTL_CYCLE3.1 which includes turn code for the lower timeframes (5, 3, 1). Note: only the 2 functions and 2 indicators need to be imported, the rest of the funcitons pulled in by the TradeStation export process can be ignored.
 

Attachments

  • TURNCODE.ELD
    25.9 KB · Views: 28
Here are the two chunks of TS2000i code for testing the MACCI-653 in the way I've described.

The first chunk contains the Indicator and the extra code detect the signal to output it to a GV.
Lines highlighted in Blue are effectively the original code for the indicator.
Lines highlighted in Red are the additional lines of code added to grab the signal and output it to a globalvariable.

The second chunk picks up all the GV's and analyses them looking for a composite signal.
Note to programmers, I haven't bothered checking the Error code status's. It all seems to work well enough without that. Also the way T2W appears to treats spaces in a post means that the first Print line in the second chunk doesn't line up with the data in the second print line. This won't happen using proper ELS code. I posted this way to highlight things using colours


CHUNK 1:-

inputs:

Length1(6),
Length2(5),
Length3(3);

Vars: CCIval(0), CCIavg(0), MACCI( 0 ), MacciT(0), RtnVal( 0 ),SIGNAL(0) ;

CCIval = CCI(Length1);
MACCI = average(CCIval, Length2);
MACCIT = average(CCIval, Length3); {MACCIT is the Trigger line}


If MACCI >80 then begin
If MACCIT < MACCI then Signal = 2
else Signal = 0 ;
End;
If MACCI < -80 then begin
If MACCIT > MACCI then Signal = 1
else Signal = 0;
End;
If MACCI < 80 and MACCI > -80 then begin
If MACCIT > MACCI then Signal = 1
else begin If MACCIT < MACCI then Signal = 2;
End; end;


if RtnVal >= 0 then
Plot1( MACCI, "1m" ) ;
Plot2(MACCIT,"MT");

Plot3(Signal,"Signal");

If Signal = 2 then begin
RtnVal = GVSetNamedFloat( GetSymbolName + "76", SIGNAL );
end;

{COMMENT - GetSymbolName + "76", is the Globalvariable name for this timeframe i.e. 60 mins. For other timeframes it will be different as can be seen in the second chunk of code below.

If Signal = 1 then begin
RtnVal = GVSetNamedFloat( GetSymbolName + "76", SIGNAL );
end;
If Signal = 0 then begin
{RtnVal = GVSetNamedFloat( GetSymbolName + "76", SIGNAL );
end;


Value1 = Ticks ; { Force RadarScreen to update every tick. }

------------------------------------------

CHUNK 2 (this code is the same for all tests) :-

inputs:
ErrorCode1( -1 ) ,
ErrorCode2( -1 ) ,
ErrorCode3( -1 ),
ErrorCode4( -1 ) ,
ErrorCode5( -1 ) ,
ErrorCode6( -1 ) ;
variables:
RtnVal1( 0 ) ,
RtnVal2( 0 ) ,
RtnVal3( 0 ) ,
RtnVal4( 0 ) ,
RtnVal5( 0 ) ,
RtnVal6( 0 ) ,
Message( "" ),
Signal(0);
if LastBarOnChart then begin
RtnVal1 = GVGetNamedFloat( GetSymbolName + "71", ErrorCode1 ) ; {60 mim}
RtnVal2 = GVGetNamedFloat( GetSymbolName + "72", ErrorCode2 ) ; {30 min}
RtnVal3 = GVGetNamedFloat( GetSymbolName + "73", ErrorCode3 ) ; {10 min}
RtnVal4 = GVGetNamedFloat( GetSymbolName + "74", ErrorCode3 ) ; {5 min}
RtnVal5 = GVGetNamedFloat( GetSymbolName + "75", ErrorCode3 ) ; {3 min}
RtnVal6 = GVGetNamedFloat( GetSymbolName + "76", ErrorCode3 ) ; {1 min}
end;
{Market Long or Short ?}
Condition1 = (Rtnval3 = 1 and Rtnval2 = 1) OR (Rtnval3 = 1 and Rtnval1 = 1); {10 and 60or30 Long}
Condition2 = (Rtnval3 = 2 and Rtnval2 = 2) OR (Rtnval3 = 2 and Rtnval1 = 2); {10 and 60or30 Short}

{Entry Long or Short ?}
Condition3 = (Rtnval6 = 1 and Rtnval5 = 1) OR (Rtnval6 = 1 and Rtnval4 = 1); {1 and 3or5 Long}
Condition4 = (Rtnval6 = 2 and Rtnval5 = 2) OR (Rtnval6 = 2 and Rtnval4 = 2); {1 and 3or5 Short}
Plot1(" ","Alert");
If Condition1 and Condition3 then begin

Plot1("LONG ","Alert");
SetPlotBgColor(1, cyan);
Print(Playsound("C:\sierrachart\alertsound2.wav"));
Print(Date,Time," 60"," 30"," 10"," 5"," 3"," 1"," LONG");
Print(Date,Time," ",Rtnval1," ",rtnval2," ",rtnval3," ",rtnval4," ",rtnval5," ",rtnval6,"LONG");
end;

If Condition3 and Condition4 then begin

Plot1("SHORT ","Alert");
SetPlotBgColor(1, Red);
Print(Playsound("C:\sierrachart\alertsound2.wav"));

{COMMENT - the line of code above plays a sound file when a composite signal is detected. It can be removed or altered to use a sound file from your own PC}

Print(Date,Time," 60"," 30"," 10"," 5"," 3"," 1"," SHORT");
Print(Date,Time," ",Rtnval1," ",rtnval2," ",rtnval3," ",rtnval4," ",rtnval5," ",rtnval6,"SHORT");
End;
Value1 = Ticks ; { Force RadarScreen to update every tick. }

This is pretty much what we had in our 1st version of the TT_CYCLE & TT_ENTRYPOINT code, so I heartily agree !

Obviously the difference is in how we decided the trigger point. The TT_MTL_CYCLE3 does the same thing but removes the need for Global Variables whilst simultaneously discovering a bug in Tradestation which ensures it occasionally throws out ****ty data.

When seperating the scripts onto seperate charts, you need to ensure that when multiple time frames roll over at the same time e.g. the 60,30,10,5,3,1 all roll over and set their global variables BEFORE the script that analyzes the result of those global variables. Charlton and I are looking at execution sequence and I also have a bug report in at Tradestation with a simple test script that highlights the issue they have with processing multiple time frames.

Are we looking for people to define the specs for this (bias, trigger points) for each indicator or will you define that & then they come up with the code ?
 
When seperating the scripts onto seperate charts, you need to ensure that when multiple time frames roll over at the same time e.g. the 60,30,10,5,3,1 all roll over and set their global variables BEFORE the script that analyzes the result of those global variables. Charlton and I are looking at execution sequence and I also have a bug report in at Tradestation with a simple test script that highlights the issue they have with processing multiple time frames.

Doing it my way means the second chunk will update one tick later than the first, so yours is more accurate in real-time because you can control the logic in one script and it will all run through on each tick. Whether the difference is that important I don't know.

Are we looking for people to define the specs for this (bias, trigger points) for each indicator or will you define that & then they come up with the code ?

At the moment it's hard (for me) to judge what individuals are capable of regarding either of those two things. I think we'll need to canvas the volunteers to find that out.
Perhaps now that they can see more of what is required they will post regarding their ability. [Sorry to talk about you in the third person gentlemen ! :) ]
I guess the result will be a mixed bag, so for example regarding coding I was trying to put a testbed together which would hopefully be easy for people to understand and adapt to a particular indicator.
If they can modify your code instead, then fine.

Edit. Just to add that we have TS8 and TS2000 users here and I suspect that the majority are using TS2000. Either way there will be the need to have two versions of each script for both testing and live use. The broker connection is an added complication down the line.

I think we're just feeling our way along at the moment, as information comes to hand.
Glenn
 
Last edited:
All Data Everywhere dll

Pedro

I have installed ADE and set up their first example and it looks very promising.

I am attaching 2 screen prints. The first shows the 30 min chart of MSFT where you can see the data values of the 19:30 30 min bar.

It shows open 20.97, high 21.25, low 20.90 and close 21.21

The indicator is set ot update value tick by tick intrabar

The second shows the 5 min chart of MSFT at 19:40. The coloured plots are showing the 30 min values derived by ADE, and the data window shows the current 5 min bar values and also the static 30 min values. At 19:50 I can confirm that the 30 min values remain as they were and they correspond with the 30 min chart.

More later ......

Charlton
 
Forgot attachments

Forgot attachments

Pedro

I have installed ADE and set up their first example and it looks very promising.

I am attaching 2 screen prints. The first shows the 30 min chart of MSFT where you can see the data values of the 19:30 30 min bar.

It shows open 20.97, high 21.25, low 20.90 and close 21.21

The indicator is set ot update value tick by tick intrabar

The second shows the 5 min chart of MSFT at 19:40. The coloured plots are showing the 30 min values derived by ADE, and the data window shows the current 5 min bar values and also the static 30 min values. At 19:50 I can confirm that the 30 min values remain as they were and they correspond with the 30 min chart.

More later ......

Charlton
 

Attachments

  • ade01.png
    ade01.png
    41.2 KB · Views: 51
  • ade02.png
    ade02.png
    53.1 KB · Views: 45
ADE example showing MACCI

Pedro

To continue the previous example. Here we see the MACCI values from the 30 min chart being passed to the 1 min chart using ADE. In fact you can pass more than 1 indicator at the same time.

Charlton
 

Attachments

  • ADE03.png
    ADE03.png
    53.8 KB · Views: 50
There's been discussion of have a short sma of the oscillator line as a crossover signal. Some functions for this:

TT_Osc_Cross:
// Pass back an indication on whether a short MA has crossed above or below the
// the oscillator.
// Returns:
// -1 - Crossed downwards
// 1 - Crossed upwards
// 0 - No cross

This indicates on the current/last bar.

A variation is to pick up which bar in the past, within a given interval, the crossover happened.
TT_Osc_Cross_Bar:
// Returns how many bars ago the crossover occurred.
// Parameters:
// Cycle - Oscillator value, e.g. from TTCycle.
// Length - SMA length
// NBars - Number of bars to search for cycle turn.
// Return value is how bars ago the crossover occurred.
// It is negative for a cross downwards, positive for a cross
// upwards and zero if no turn was found within NBars.


Included: test indicator #TT_Osc_Cross and an amended #TT_MTL_CYCLE3.1 which includes crossover code for the lower timeframes (5, 3, 1). Note: only the 2 functions and 2 indicators need to be imported, the rest of the functions pulled in by the TradeStation export process can be ignored.

Also a revised TT_Cycle_Turn_Bar function.
 

Attachments

  • OSCCROSS.ELD
    26.7 KB · Views: 27
  • CYCLETURNBAR.ELD
    3.7 KB · Views: 31
Forgot attachments

Excellent! I use TS8.3 so I am not sure if I need to revise TS2000i codings for TS8.3. Personally I prefer to combine the use of Inverse Fisher (for higher TF) and MACCI for lower TF to determine turning points. any suggestions? thanks,..
 
Moreagr
At present I think that any tests will have to be run during the day.
If you are trading at the same time then the tests will add some overhead to your processing, so it depends on how powerful your PC is and how much memory it has.
The way I'm thinking about testing at the moment means you would have 7 additional radars running each containing INDU, i.e. 6 for the different timeframes and one for the MTF analysis.

As regards VWAP I don't think that it will be part of the project, at least in the beginning. However it's not my decision.
Glenn

Hi Glenn thanks for your response, would it be a problem to ask for a screen shot of and setup of radars so I can view it the way you are seeing it and move on from there.

I am super lost with most the disscussions in developing with ADE and QV.. I still have not used QV but I need to buckle down and figure out how to use those tools (my ADD is not helping and am on better meds for focusing now) I am going to try hard the next few weeks and understand all the feeding analysis. I want to be a team member.

the only good thing about ADD and obessive compulsive disorder is I never give up LOL :smart:
 
Excellent! I use TS8.3 so I am not sure if I need to revise TS2000i codings for TS8.3. Personally I prefer to combine the use of Inverse Fisher (for higher TF) and MACCI for lower TF to determine turning points. any suggestions? thanks,..


LV,

have you been given the sceener yet in TS 8.4? I have not yet. this could be a great tool.
I think its in beta testing still
 
Hi Glenn thanks for your response, would it be a problem to ask for a screen shot of and setup of radars so I can view it the way you are seeing it and move on from there.
Moreagr
See pic attached.

Just found a bug I think - off to have a look ....

Glenn
 

Attachments

  • M653 radars.JPG
    M653 radars.JPG
    70.5 KB · Views: 65
What is the bug you think you have found ?


Paul

T'is what appears to be a discrepancy between the GV's sent and those received.
Just added "If Lastbaronchart then begin" to try to fix it. Have to watch the data now.

Also I haven't seen a Short signal yet in live running, but that may just be circumstantial.
PC was in bits yesterday having a new motherboard, so lost data. Took the engineer 15 mins ! Dell + service are superb.
Glenn

OK sorted now.
Let's see if anyone spots the changes needed in the code.
Glenn
 
thanks Glenn

Just as I've overcomed my shyness in posting this interesting thread has dried up.
Perhaps it was Glenn's challenge.
Copy and paste is a wonderful thing (when applied conditionally) isn't it Glenn:)

Any way this is only the start of a long journey that I'd like to travel and volunteer for testing or whatever I can contribute

I'd like to make some observations regarding the quality of testing.
Everybody has spent hours, running indicators and observing entry and exit results, mostly informally done.
When you get quantitative about it, problems arise comparing various parameters and also different indicators.

The only thing that is certain with real-time data testing is that when you attempt to repeat a test with changed parameters, the data and hence the results will be different .

In comparing different indicators or parameters, you need to do this on the same data every time for comparisons to be meaningfull.
Half a dozen indicators could be tested concurrently but its probable that others come latter or changes get made and can't be compared accurately
The test data needs to be representatative and sufficient. Obviously a price-time series that is sufficient to generate 100 signals is better than one which only generates 20.
There is no reason why real data shouldn't be used. More than one series can be captured e.g. from a choppy market or a steady market.
A lot of work has been done in this field by workers [ eg Chande] taking real prices as a base and introducing a "randomising" element. This can demonstrate that some indicators are more resilient than others but can also effectively eliminate some that depend on very specific price patterns. The latter tend to be killed completely by randomisation of data.

There is scope for discussion about such generated data.
If required, I can offer a simple tool to create this.

What is a good result?
If we test for sharp entries, this begs the question " What is a successful entry"

To my mind (for testing) it is any entry that offers the opportunity to exit at better than break-even allowing for slippage, spreads and costs. That could mean a minimum profit at least equal to the spread (after costs). A test criteria needs to be agreed

The question of how persistent a position remains after entry (run your profits) is obviously important but requires an exit strategy to be defined.

Martin
 
Hi,

Just thought Id make a quick post offering my services - I have been reading the TT forum back to front and finally read my way through this thread.

Separate to this thread I have programmed this strategy in NinjaTrader (using C#). Functionally all the components are working and by the sound of it I've followed a similar approach to you guys and am currently just working on optimization. Having tested a few oscillators I've settled on one to do some more thorough testing with and just working on how best to balance volume vs. quality of buy/sell signals.

So not sure if I can be of much help as all the work I have done is in NinjaTrader but let me know if there's anything I can do.
 
Top