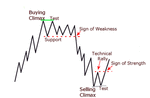
Price, (Volume), Support, Resistance, Demand, Supply . . .

dbphoenix said:
If by "sophistication" you mean where do you set price targets, stops, etc, that comes from developing a thorough familiarity with the territory rather than coming up with increasingly elaborate maps. If, for example, sellers can't find a trade in one direction, they'll look for it in the opposite direction. And they'll continue to fish until they catch something. If they catch something, and the catch attracts attention, it's up to you to determine the criteria for entering the move, as well as the criteria for exiting the move if it turns out to be short-lived.

You have no way of knowing whether a given move will continue or not, nor do you have any control over same. But you can determine the criteria for deciding when to scale out or exit. You always have absolute control over that.

Hi dbp
thanks for your valuable contriutions to this site and to those who ask you the right questions.. the bramble, bracke and the others. I read with interest but I'm not a fast typist and I don't always have the time to post. A couple of clarifications please?

By "sellers" do you mean traders selling or MMs? If MMs, would I be right in saying that the MMs are looking for where volume will come from? Would "the catch attracts attention" mean the beginning of a price movement in that (new) direction? Wouldn't this also (or instead) mean more involvemnt, therefore more volume? Am I on the right line of reasoning? :confused:
 
recognizing inertia

dbphoenix said:
On the other hand, one must accept the fact that the outcome of any given trade is unknowable, which is generally at odds with what most traders mean by "prediction".

I am studying the methods I use to enter trades.
On the one hand, I know that markets are completely uncontrollable and unpredictable. It's the thing I like best about trading on pirce action. - I know I do not have access to all of the fundamental factors that affect price action (no one does). Fortunately what people think about those fundamental (and technical indicators) are all reflected right now in the price/volume action. Any changes in peoples beliefs, or strategies will be reflected in this tick and the next.

On the other hand, markets seem to exhibit inertia. They go along the in the trend or channel they are currently in, until something changes. So what changes? (See paragraph above). The cause of the change is irrelevant.

So the skill that I am working on now is the ability to see that inertia. I need to know if it is changing or staying the same, so that I can execute my trading plan. For me, right now- recognition of inertia (what's the speed and direction right now?) is the only form of prediction I am after. I can't seem to begin to grasp it unless I am looking at several time frames of the same instrument.

JO

JO
 
JumpOff said:
So the skill that I am working on now is the ability to see that inertia. I need to know if it is changing or staying the same, so that I can execute my trading plan. For me, right now- recognition of inertia (what's the speed and direction right now?) is the only form of prediction I am after. I can't seem to begin to grasp it unless I am looking at several time frames of the same instrument.

If you've determined that something is in a trend, then you're not looking for prediction but rather for acknowledgement. Why predict something that already exists?

As for finding a way to determine whether or not it is changing in some way so that you can execute your trading plan, does this mean that you focus on reversals?
 
dbphoenix said:
If you've determined that something is in a trend, then you're not looking for prediction but rather for acknowledgement. Why predict something that already exists?
Right. You said what I meant, only better.

As for finding a way to determine whether or not it is changing in some way so that you can execute your trading plan, does this mean that you focus on reversals?
Yes. I try to buy at support and sell at resistance, so that if the inertia changes, I'll see it and get out right away. If the situation continues without change, then I am in a position to let things run.

Sounds simple, but hard for me to do. Support and resistance are a zone, not a line, so I am working on waiting until I see some reasonable confirmation (the reversal happened or it did't).

Wow! Oh my god! I just looked again at the image on your yahoo group (that you linked to earlier in this thread) I think I see what I've been doing wrong! I hope you don't mind, I've edited the graphic you directed us to in your earlier post to show what I believe I'm doing wrong.
Selling at the green line and buying at the grey will give you about a 95% failure rate (trust me on this one)!

JO
 

Attachments

  • Socs_chart.gif
    Socs_chart.gif
    9.6 KB · Views: 815
JumpOff said:
Selling at the green line and buying at the grey will give you about a 95% failure rate (trust me on this one)!

Well, yes and no. If you sell at the first point you're using to draw the green line or buy at the first point you're using to draw the gray line, then, probably, since you have no evidence that the trend has reversed. But this is covered in the Demand/Supply file.
 
Derivatives?

Hi,
I am reading the Demand/Supply document again. I think I understand a little more of this relationship when you are talking about stocks (that have a finite supply), and I'm wondering if the same principles apply to derivatives.

My understanding is that many spot, futures, indexes and other derivatives can have volume completely unrelated to the underlying commodity. I think I read somewhere that the number of corn contracts that are actually sold by farmers and bought by grain processors only make up 10 % of the CBOT corn volume overall. If this is true, then all that is necessary to increase volume is for a willing buyer and seller to pair up at an agreed upon price. I think I read the same thing about the FOREX (more than 80% speculators). The ability to short at any time without owning the underlying commodity confuses my thinking about selling pressure. The sellers may not be looking for a profit on their former consolidation and markup phases. They may just look at the chart and see the price going down and say, "well this looks like a couple of ticks that are meant for me.."

In a market where 90% of the traders are buying/selling things that don't exist as long as they agree on the price, do all of the same stock type principles apply? Does the speculator add more than just liquidity? Is there a tipping point where the speculators involvement changes the nature of the game?
JO
 
JumpOff said:
In a market where 90% of the traders are buying/selling things that don't exist as long as they agree on the price, do all of the same stock type principles apply? Does the speculator add more than just liquidity? Is there a tipping point where the speculators involvement changes the nature of the game?
JO

The demand/supply thing is only a step, since there are obviously many cases in which supply is not finite. Actually, it isn't even finite with stocks anymore since nobody holds anything. But that's another subject.

Most beginners (and some not-so-beginners) don't fully grasp the nature of the auction market, or even that the stock market is an auction market. Since trading by price movement requires a certain perceptual and conceptual view, it's seemed best to me to start with the auction market and the law of supply and demand since this law is one of the few absolutes (perhaps the only one) in the stock market.

Moving from an understanding of the dynamics of supply and demand balances and imbalances and how they move price also seems to me to be a necessary step before getting into buying and selling pressure. Perhaps not. But given the number of people who lose their way before getting to this point, which I feel is essential to understand before developing an intuitive sense, I doubt that jumping right into the nature of buying and selling pressure would be very productive.

So, yes, the principles apply. But there's more to it. Unfortunately, to understand that "more" requires a certain amount of experience, i.e., the experience of having watched many charts and a great deal of price action as a participant and not just from some book or article. Given the amount of perceptual and conceptual reconstruction that is usually required, it's no mystery that most people would rather just buy when the blue line crosses the red line and sell the opposite.
 
As a PS to the above post, I should point out that the "operator" (or equivalent term) referred to by Wyckoff, Livermore et al and in the Demand/Supply file is today a somewhat irrelevant and quaint artifact of days gone by. Given the hundreds of funds, the thousands of investors, and the more thousands of traders, manipulation is far more difficult than most people believe. The "operator" is primarily a conceit to illustrate and people the process whereby stocks (and thereby markets) are accumulated, marked up, distributed, and marked down. There are no groups of shadowy figures lurking in the half-light, waiting to pull the rug out from under you and run away with your money, chuckling gleefully. Believing that there are is the primary reason why so many novices try to "catch reversals" where no reversals exist.

However, it is naive to believe that brokerages issue buy ratings on stocks they don't already own or that they issue sell ratings on stocks they haven't already sold. The process of accumulation, markup, distribution and markdown is as absolute and inescapable today as it was a hundred years ago and before. The "operator", however, is the market itself.
 
dbphoenix said:
Most beginners (and some not-so-beginners) don't fully grasp the nature of the auction market, or even that the stock market is an auction market. Since trading by price movement requires a certain perceptual and conceptual view, it's seemed best to me to start with the auction market and the law of supply and demand since this law is one of the few absolutes (perhaps the only one) in the stock market.

And therein lies the rub :) . Our charts and their price and volume bars allow us to interpret what has happened to supply and demand in the past but only in respect of those who have chosen to enter the auction during the time period we examine. They do not, of themselves, allow us to answer the fundamental question of who is waiting in the wings - whether the demand queue is longer than the supply queue (or vice versa) and the supplementary question of in which queue lurk the big guns.

To gain some clues toward answering these questions we look at the price and volume bars and although we might gain such clues from what they look like, it seems equally important to establish how they emerged. For example, you could have two days where the price action and overall volume looked the same - let's say this was a down during the day, but closing on the highs. If, however, one of those high closes was on high volume and the other on low volume I think you might arrive at different conclusions even though the price and volume bars for the day would look pretty much the same. :?

good trading

jon

ps: thanks for your comments on the ftse chart bramble and sulong
 
very interesting

Hello everyone,
Interesting conversation about price, buying pressure, selling pressure and then support and resistance areas. Does anyone take a look at how time should also be factored in to one's analysis?

erie
 
Hi ER, welcome to t2w.

It's interesting you ask this. There have been a number of threads recently where the use of time, both normal and otherwise has been discussed.

Why do you ask and in what way do you either currently factor time into your analyses or are you considering doing so?
 
Haven't had the time to study the whole of this thread in depth but has strength and weakness been discussed ?

I use price and volume to seek out the existence of strength and weakness. For examle, if a particular stock is trending upwards and I see particular evidence of strength in the chart from the price and volume bars, then I can be persuaded to enter a long trade. For a short trade I would be looking for evidence of weakness in a down trending market.

Seems to work very sweetly.
 
TheBramble said:
Hi ER, welcome to t2w.

It's interesting you ask this. There have been a number of threads recently where the use of time, both normal and otherwise has been discussed.

Why do you ask and in what way do you either currently factor time into your analyses or are you considering doing so?

Will try and look at those threads. Basically I look at the swings, their angle and duration, and go from there. Anyone else?

erie
 
erierambler said:
Will try and look at those threads. Basically I look at the swings, their angle and duration, and go from there. Anyone else?
Erie, you're up early...

I have also used angles on swings but found is was so (obviously) dependent upon your X-axis timeframe that it made little logical sense, but could be used, as can any system, if you keep the parameters the same.

I misunderstood your first post here on this subject Erie - I imagined you were doing something a little more unusual than using the temporal angler other than as a backdrop for the other factors.
 
TheBramble said:
Erie, you're up early...

I have also used angles on swings but found is was so (obviously) dependent upon your X-axis timeframe that it made little logical sense, but could be used, as can any system, if you keep the parameters the same.

I misunderstood your first post here on this subject Erie - I imagined you were doing something a little more unusual than using the temporal angler other than as a backdrop for the other factors.

The angle is not as important as the duration. The angle only helps to identify the speed of the movement.
I'm an early bird and early to bed as well.

erie
 
TheBramble said:
I have also used angles on swings but found is was so (obviously) dependent upon your X-axis timeframe that it made little logical sense, but could be used, as can any system, if you keep the parameters the same.
.

The standard aspect ratio is 1.5-2:1, or a rectangle made up of the equivalent of two adjacent squares. This probably has something to do with standard paper sizes, but I've never investigated it.
 
Salty Gibbon said:
Haven't had the time to study the whole of this thread in depth but has strength and weakness been discussed ?

I use price and volume to seek out the existence of strength and weakness. For examle, if a particular stock is trending upwards and I see particular evidence of strength in the chart from the price and volume bars, then I can be persuaded to enter a long trade. For a short trade I would be looking for evidence of weakness in a down trending market.

Seems to work very sweetly.

How are you defining your terms, i.e., "strength" and "weakness"?
 
In general and simple terms which is how I like to keep things :-

Strength = a lack of supply pressure in an uptrend
Weakness = a lack of demand pressure in a downtrend
 
Salty Gibbon said:
In general and simple terms which is how I like to keep things :-

Strength = a lack of supply pressure in an uptrend
Weakness = a lack of demand pressure in a downtrend

Based on these definitions, this is in large part what the thread has been about, so I'm not sure what you were going for in your original question.

As for the thread, it's had extraordinarily few off-topic posts. I should think that the whole thing would be worth a read, but I'm not in a position to judge. Questions, in particular, have been unusually good.
 
As I said Dbp I haven't read the thread in its entirety so I just wondered if my take on strength and weakness had been considered.

When I find time I will copy and paste the relevant posts on this thread into a Word File and have a good read.

Basically, my angle has always been to keep things very simple in trading and I find that the way I use price and volume to seek out strength and weakness, backed up by my favourite indicator ( so not fully a darksider ) works very nicely.

A quick read of some posts on this and other threads relating to Price and Volume have led me to the conclusion that maybe people are looking for complexity where probably none exists.

Just a thought and my apologies if this post is considered slighty off-topic.
 
Top