Price, (Volume), Support, Resistance, Demand, Supply . . .

Don't thank me yet.

If you're interested in forex, you needn't concern yourself with accumulation and distribution as there isn't any: there's no float. And you needn't concern yourself with what market makers and institutions are doing: you need only concern yourself with what price is doing.

Which leaves the demand/supply, support/resistance thing which, if you've ever bought or sold anything, you already know. Therefore, apply what you know to the chart and keep your wallet in your pocket: no courses, no DVDs, no software, no indicators. Anyone who is trying to make this more complicated than it is in order to sell you something should be viewed with skepticism.

I'd suggest reading this thread, but a thousand posts is a bit much. Maybe the pdf I uploaded a few posts back. And it's free.

Db

Will do, tyvm
 
Don't thank me yet.

If you're interested in forex, you needn't concern yourself with accumulation and distribution as there isn't any: there's no float. And you needn't concern yourself with what market makers and institutions are doing: you need only concern yourself with what price is doing.

Which leaves the demand/supply, support/resistance thing which, if you've ever bought or sold anything, you already know. Therefore, apply what you know to the chart and keep your wallet in your pocket: no courses, no DVDs, no software, no indicators. Anyone who is trying to make this more complicated than it is in order to sell you something should be viewed with skepticism.

I'd suggest reading this thread, but a thousand posts is a bit much. Maybe the pdf I uploaded a few posts back. And it's free.

Db

Welcome back :)
 
This question pertains to me as well. I would be asking this question but it is about stocks. I trade stocks.

Thanks in advance!

I assume you're talking about all the questions. Even so, what I replied applies to stocks as well, except that accumulation and distribution are a consideration for you. That gives us (1) market makers and institutions, which you needn't worry about, at least in terms of telling the future, (2) the law of supply and demand, and (3) the nature of support and resistance.

The terms "supply" and "demand" have become corrupted over the past dozen or more years by vendors. Put at its simplest,
When demand exceeds supply, prices rise, and when supply is greater than demand, prices decline. This is true not only of stocks; it is constantly being demonstrated in markets for wheat, corn, cotton, sugar and every other commodity that is bought and sold; also, it is reflected in other markets such as real estate, labor, etc.
(Richard Wyckoff)

Demand and supply are factors in every trade. If they were not, there would be no trade. Therefore, to talk about "demand zones" or "supply zones" is misdirection. What is more accurate is the placement of support and resistance zones, or levels. Granted demand/supply and support/resistance are related since the whole idea of providing support, for example, is based on some degree of demand. But while demand and supply can create support and resistance, they will also accompany any move, even the most random and chaotic.

As to support and resistance themselves, put simply, support is the price at which those who have enough money to make a difference are willing to show their support by retarding, halting, and reversing the decline by buying. Resistance is the price at which those who have enough money to make a difference attempt to retard, halt, and reverse a rise by selling. Whether one calls this money professional or big or smart or institutional or crooked or manipulative or (fill in the blank) is irrelevant. If repeated attempts to sell below this support level are met by buying which is sufficient to turn price back, these little reversals will eventually form a line, or zone. Ditto with resistance. These efforts generally create zones rather than lines since price is unlikely to come to a screeching halt at the same tick every time. Some people are forever early. Others are forever late.

A swing high or low, on the other hand, represents a point at which traders are no longer able to find trades. Whether that point represents important support or resistance will be seen the next time traders push price in that direction (if they don't, then you've got a "V" reversal). But everyone knows this point, even if they aren't following a chart. It exists independently of the trader and his lines and charts and indicators and displays (the high of the day is the high of the day whether one is using a one-tick chart or a daily chart). It is the point beyond which price could not go. Hence its importance, both to those who want to see price move higher and those who don't. Whether or not a beginner should be trading these points will depend to a large extent on how quick he is on his feet and how well he's dealt with his fear issues.

Specifics, of course, are better addressed with a chart, if there is one in particular you were curious about.
 
Re: I've found them!

Can anyone help with an updated link to the pdf?
Thanks
Hi yiehom,
Here's a free taster
If you want the dbp's actual book, you'll need to buy it from dbphoenix direct. (He appears to be monitoring these boards again - so you could send him a PM.) He used to charge about USD$30.00 for it. Mind you - that was quite a few years ago!
Tim.
 
Re: I've found them!

Thanks a lot.
Profitable 2013 to you

Hi yiehom,
Here's a free taster
If you want the dbp's actual book, you'll need to buy it from dbphoenix direct. (He appears to be monitoring these boards again - so you could send him a PM.) He used to charge about USD$30.00 for it. Mind you - that was quite a few years ago!
Tim.
 
Just a quick question in regards to supply/demand imbalances due to price moving. I know market orders get matched to limits (thus causing possible movement) however, what about Buy sell stops, stop losses. Can these get matched to limit orders or are they just treated as market orders when price hits them.

If buy/sell stops and stop losses are treated as market orders, do they not show up on DOM (refering to futures etc).

Thanks!!
 
Since no one has replied . . .

Waiting for your stop to get you out is a mistake. If you need to exit, then exit. Assume and maintain control. But if you're going to leave it up to the stop, then make it a market order.

As to the DOM, I don't pay any attention to it.
 
A Trade Review Request from dbphoenix

Hey dbphoenix, would you mind reviewing my trade and answering my question?

My entry and and my reasons for it.
1-15-13eurjpyh1demandzone_zps7a2d1b59.gif

EURJPY Hourly Time Frame

1-15-13eurjpyh1demandzoneloss_zpsf3514d90.gif

EURJPY 30 Min Time Frame

My question is: Why is the lower demand zone was the turning point instead of the one I picked above which had a strong move up in price?

Thanks
 
Re: A Trade Review Request from dbphoenix

Hey dbphoenix, would you mind reviewing my trade and answering my question?

My question is: Why is the lower demand zone was the turning point instead of the one I picked above which had a strong move up in price?

Thanks

Something tells me you've read a book or taken a course or watched a DVD. Maybe even bought some software that's compatible with what you've read, taken, seen. There's no way you could have come up with this stuff on your own. This is no criticism of you. Everybody's got to start somewhere. But you're on the wrong track.

But that wasn't your question. And it's difficult to answer your question without sounding like a smartass since the reason why price turned where it did is that buying pressure overcame selling pressure to an extent which turned price. A more pertinent question would be why you'd want to go long in a downtrend. Or, if you view this as a long-term uptrend, at least since August, why you'd be (a) entering a long here and (b) using such a tight stop.

I don't know anything about you or what kind of trading plan you have, but I'd be happy to show you a much simpler way of approaching this without getting all tangled up in vendors' BS.

Let me know.
 
Re: A Trade Review Request from dbphoenix

Something tells me you've read a book or taken a course or watched a DVD. Maybe even bought some software that's compatible with what you've read, taken, seen. There's no way you could have come up with this stuff on your own. This is no criticism of you. Everybody's got to start somewhere. But you're on the wrong track.

Yea I've been following Sam Seiden's webinar on fxstreet and his articles.

A more pertinent question would be why you'd want to go long in a downtrend. Or, if you view this as a long-term uptrend, at least since August, why you'd be (a) entering a long here and (b) using such a tight stop.

I think these questions somewhat answered my own questions.
Now that I was wrong, I think my mind will look for ways the justify what happened. And this is what I have came up with:

This trade set up was supposed to be a short-term trade, but looking it at it a bigger time frame, from the monthly chart, I guess the price is further out on the curve. And on the weekly chart I am on a supply level, around 119-121 area.

Now that it was a loss I can see that buying in that price gives me such a tight range to make real profit margin in a bigger time frame.

Why did I buy in there?
Because of what the chart presented into me. The strong movement in price in that area because of the imbalance of supply and demand order flow. The amount of time spent in the basing (indecision of buyers and sellers) is small, not a lot of candles in there. And the profit margin that I saw was good enough, at least +3:1 reward-to-risk ratio. I guess I didn't look at my demand zone compared to the big picture of the overall trend.

I don't know anything about you or what kind of trading plan you have, but I'd be happy to show you a much simpler way of approaching this without getting all tangled up in vendors' BS.

Let me know.

Yea I'd be glad to learn from you man. I just don't want to clog my screen with technical indicators. I want to be sufficient at reading the price action alone and be able to predict an area where the market turning points are.
 
Last edited:
I don't know how far you want to go with this. If you're happy with what you're doing and making consistent profits (decent profits, not just walking-around money), then you may not want to pursue it. However, if you're not happy with what you're doing, you're going to have to forget a few things, or at least set them aside for the time being.

The whole demand/supply thing seems to appeal to you, which is good, because everything hinges on the relationship between demand and supply. Which is why it's a law. Unfortunately, the meanings of "demand" and "supply" have become corrupted over the past dozen years, mostly by people who want to sell you something.

"Demand" means just that, people are demanding something, buyers want to buy. At least at a reasonable price. Or what they consider to be a reasonable price. This may not be what the seller considers to be a reasonable price. So they deal. Which is why prices fluctuate with each transaction.

"Supply" refers to what sellers have to sell. However, except in the case of those instruments that have a float, like stocks, "supply" does not refer to a quantity of something. There are no big tractor trailers full of futures contracts out there. Nor is there any "supply" in forex. Therefore there is nothing to be hoarded. Therefore, there is no "accumulation". Or "absorption". Or "distribution", for that matter.

This may be a pretty big wad for you to swallow, but you needn't swallow it right now. You can put it off to one side and just look at it when you have some time to kill. What you can do instead, and need to do, is think about buying interest/pressure and selling interest/pressure instead. These are after all what move price, and you are in the end interested in what moves price.

Buying and selling interest precede buying and selling pressure. Buyers after all have to be interested in whatever it is before the issue of pressure comes up. If they aren't interested, the issue of pressure is not pertinent. Which explains why those who buy "depressed" stocks so often end up wasting their money: nobody's interested in the stock. And so it sits.

But the issues of buying and selling interest are of no concern with futures and forex. There's plenty of interest. Your task is to judge the balances and imbalances between buying and selling pressures so that you know whether to go long or short, when, how, and for how long.

And you needn't concern yourself with reward:risk ratios. You never know how far price will go. Concern yourself with the risk. The reward will take care of itself.

But that's enough for one post. I'll get to the nitty-gritty in the next one.
 
.

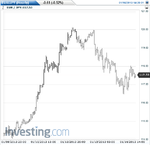
This is the chart that's under consideration:


attachment.php


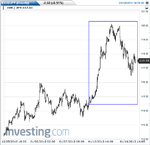
This is where the above chart, showing the current trend, fits in the "pre-trend" context:


attachment.php


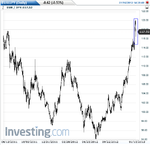
And this is where the overall trend began:


attachment.php


This is not to suggest that if you didn't buy in July '12 that you're wasting your time. But you should always look at the context, not so much to determine where you should enter, but to get a sense of where you have been and are with regard to the balance between buying pressure and selling pressure.

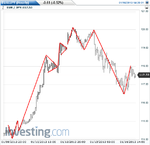
Now look at these buying and selling "waves". What do you see?


attachment.php
 

Attachments

  • eurjpy1.png
    eurjpy1.png
    21.6 KB · Views: 1,761
  • eurjpy2.png
    eurjpy2.png
    24.4 KB · Views: 1,835
  • eurjpy3.png
    eurjpy3.png
    26.3 KB · Views: 1,829
  • eurjpy4.png
    eurjpy4.png
    32.2 KB · Views: 1,753
I see a continuation trends as buying pressure continues to overwhelm the selling pressure until the first top. It drop down near 119 and buying pressure stopped it from dropping further. The price rose up to 120 and selling pressure definitely took over below 119 because there was less buying pressure and more selling pressure.

I also see symmetrical triangles and a double mountain now that you've drawn them. From what I understand those symmetrical triangles are consolidation, indecision of buyers and sellers reaching to a point of agreement of virtually one price, until the buying and selling becomes imbalance again. This time the buying pressure won in the first big wave of the trend in the H1 time frame.

Now that you've zoomed out, I can definitely see where the current price is at compared to the overall major trend. I've also checked out the pair in the weekly and monthly time frame to get the whole story. That definitely helps me underatand
 
.

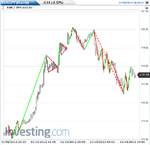
You're with me so far. That helps. Now look at this a bit more closely. The chart below is the same as the chart above only color-coded (I'm not fond of color-coding, but, in this case, it helps to clarify things) and somewhat more detailed on the most recent downswing.

After the waves themselves, the most important thing to look at is the comparative lengths, i.e., which waves are of greater length and duration? Clearly the buying pressure has the upper hand on the way from the lower-left of the chart up to the top. There are a couple of breathers along the way (the triangles or coils or hinges), but this can't be unexpected after all. Nor is it surprising that they should come so close together since the first one took so long to form. Their message, however, should not be overlooked, that indecision is setting in, and a turning point may be in the offing.

Be that as it may, notice also that the buying waves are getting shorter as you near the turning point. Think of pushing a car uphill, and getting more tired as you go, even with rest breaks. Notice further that after the turning point, the first sell wave is longer than the immediately preceding buy wave (even if you extend that last buy wave to the last triangle to fill the gap, they are at least equivalent, which is also noteworthy). Then, when a rally is attempted, not only is the buy wave shorter than the immediately preceding sell wave, but price also fails to make a higher high, or even reach the immediately preceding high. This does not necessarily mean in and of itself that you ought to go short. You don't after all know that it's going to be a lower high until price has dropped below the last swing low, which it does eventually, but you don't know that at the time. And price did find support at the apex of that last triangle. Perhaps there will be one more try at a higher high, and then you'll be left standing there with your short, missing the continuation.

Which brings me to hindsight analysis. All sales pitches, regardless of the form they take, rely on hindsight analysis. Which in and of itself is not evil. Hindsight analysis is very useful when illustrating principles and when backtesting and forward-testing setups. And I've seen some outstanding hindsight analyses. But it does not necessarily follow that the vendors and fanboys who provide them can walk the walk in real time. Purchasers of these programs and courses and software and so forth find out rather quickly that what is so impressive and so clear in the presentation just doesn't work when the pedal meets the metal. Unfortunately they too often come to the conclusion that they just don't understand it as well as they thought they did, so they go back to the well, buying more DVDs and signing up for more courses. But it doesn't get better, largely because the sales pitch is crap.

Always keep in mind, then, that you must put everything you learn from a hindsight analysis into the context of real-time trading. When the salesman says that such and such is the top, how will you know that in real time? How can he know it without knowing the future (which, of course, all hindsight analysts know)? How can he know that, for example, a selling or buying climax is present without knowing what happens afterwards? If he can't explain any of that to your satisfaction, put your wallet back in your pocket (you are, of course, in a free trial) and walk away.

So back to the chart.

You could of course short the lower high, but by the time you determine that it is in fact a lower high it may be too late for you to enter without assuming more risk than you're comfortable with. Which brings us back to the waves. Note that the selling wave that immediately follows the lower high is longer than the immediately preceding buying wave. This tells you that, for the moment, sellers are in charge. And if you approach this with some understanding of trader psychology, you'll know that this sort of thing empowers sellers and short-sellers and rattles buyers. Thus when the next buying wave is so short and doesn't even reach half the length of the preceding selling wave, the odds for a successful short shift a bit in your favor.

Which brings us to the subject of determining when and where the balance shifts again, the downtrend looks to be over, and the odds shift back to the long side. But that's another chart, which has to include what occurred after you uploaded this one. In the meantime, think about what I've said here and ask your questions.


attachment.php
 

Attachments

  • eurjpy5.png
    eurjpy5.png
    38.2 KB · Views: 1,946
Last edited:
"Supply" refers to what sellers have to sell. However, except in the case of those instruments that have a float, like stocks, "supply" does not refer to a quantity of something. There are no big tractor trailers full of futures contracts out there. Nor is there any "supply" in forex. Therefore there is nothing to be hoarded. Therefore, there is no "accumulation". Or "absorption". Or "distribution", for that matter.

This may be a pretty big wad for you to swallow, but you needn't swallow it right now. You can put it off to one side and just look at it when you have some time to kill. What you can do instead, and need to do, is think about buying interest/pressure and selling interest/pressure instead. These are after all what move price, and you are in the end interested in what moves price.

Hi db, at last some posts to do with the nitty gritty of price and movement. The poster of the original question seems to be one of a very few whom want to look deeper into price development, so good on him/her.

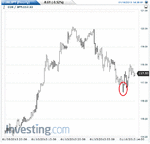
One point I would like to make, you state there is no absorbtion or accumulation in forex or futures, but can you have a stab (maybe you know for sure;)) as to why anyone would be buying in this area that I have circled?

After all, supply is in the abundance but yet "someone" is buying hard here, it cant be stops so it must be new positions.

It is very unlikely these guys are one lot wonders trying to swing at this point due to the recent fall we have had. So what reason would these traders/group have to buy here other than, accumulation (beginning), distribution (ending), or absorbtion (retaining).

Also, you are correct in saying that there is unlimited futures/forex contracts available, but there is not an unlimited amount of traders about all the time that may want to do business at a certain price.

All very interesting though:cool:
 

Attachments

  • ScreenHunter_02 Jan. 17 16.02.gif
    ScreenHunter_02 Jan. 17 16.02.gif
    22.9 KB · Views: 475
One point I would like to make, you state there is no absorbtion or accumulation in forex or futures, but can you have a stab (maybe you know for sure;)) as to why anyone would be buying in this area that I have circled?

I was going to get into this with the next chart, but I don't suppose it matters if I address it now.

It is unlikely in the extreme that an itty-bitty pause such as that represented on Jan 10, given the brief duration and the narrow range, would bring this humongous downdraft to a screeching halt. It's the kind of thing that would appeal to a vendor who's looking for something plausible (to him) and it might impress the customer who hangs on the vendor's every word. But it's nonsense.

Prices move as a direct result of trader behavior. Therefore, if one understands trader behavior, he has a leg up over those who are focused on indicators and envelopes and clouds and whatever the hell else. If sellers and short-sellers see an opportunity to profit from profit-taking or short-selling, then that's what they'll do. Where they'll do it is often determinable in advance. How they'll do it is not so easily determinable. Ditto on the opposite side with holders and new buyers. But worrying about the "why" is largely not a rewarding activity. For one thing, there's really no way of knowing, though traders have come up with some pretty bizarre "explanations" over the years. But, more important, there's just no time. When one is faced with the necessity of making a trading decision in real time, he just doesn't have time to futz around with "why". He needs to act, even if, as is likely, he has no trading plan. If he doesn't, the trade is gone. And if he's agonizing over"why", the more likely price is to move on and leave him behind.

But this 50% business has been around for a long time, more than a century, and the area you've circled happens to be a 50% retracement of this particular segment of the uptrend. And as a sign of strength or weakness, it holds true remarkably often. I don't know why, of course. But cultures, including ours, worship so many things without having the slightest idea how the worship of the thing worshipped got started in the first place. Therefore many traders may step in at the 50% level without being able to provide a rational explanation other than "it works".

I suspect, though, that it all has to do with PE ratios. Tulip manias and the market of the 20s aside, companies and stocks were valued differently back in the day, and PEs meant something. It is no leap of logic to posit that a stock at the zenith of a parabolic uptrend would carry a high PE. This might prompt some concern among fundamentalists, who might decide to engage in "profit-taking" and, in so doing, prompt concern among others who are watching the "professional money" for cues as to what to do and when to do it. This is how corrections are born. And when the PE is cut in half (traditionally they've run between 20 and 10), professional money might decide that the stock is now fairly or undervalued and that it's time either to step in and buy to halt the decline in what they already hold or to initiate new positions in stuff they don't currently have.

Makes a lot more sense than magic ratios.
 
:clap:
How fast years run! Already time to prepare for this great thread's 10th anniversary celebration.
Hope DBPhoenix is well and safe. Please communicate the program.
 
Top