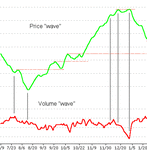
Price, (Volume), Support, Resistance, Demand, Supply . . .

So, it's price only then? Good call, Splitlink! Price lags volume! To understand volume is to understand price! Build up, overhangs, spikes and all that need to be differentiated. Price speed (time), needs to be carefully considered when applying volume to your analysis. Without volume there would be no price, so volume is just as important as price (volume is price). Think of volume as an acselerator/brake (supportive/resistive). It's not an overnight thing to master the art of volume analysis! RUDEBOY!
 
Last edited:
Splitlink said:
I've been through these posts more than once and have come to the reluctant conclusion that I am incapable of reading anything meaningful into volume figures . As has been mentioned several times, support/resistance are neither if the price is not supported or resisted at these levels. To be frank, I do not need more than an 11plus certificate to understand that, but it seems to have generated a thread of around 500 posts to philosophize about it and I have found nothing really new at the end of it all.

It seems that even the most skillful P+V reader is likely to make the same number of mistakes as any other system user and, when studying price, volume is likely to be more hindrance than help to me in deciding direction because it is so flexible in its argument. One can practically find any reason in hindsight
as to why one was right or wrong in making his decision on the basis of light or heavy volume. Therefore,
it is unlikely to be either better or worse than any mechanical method which has been reasonably backtested and is coupled with selfdiscipline.

Split
You just have to develop the ability to confront your greatest difficulties.
 
Last edited:
RUDEBOY said:
So, it's price only then? Good call, Splitlink! Price lags volume! To understand volume is to understand price! Build up, overhangs, spikes and all that need to be differentiated. Price speed (time), needs to be carefully considered when applying volume to your analysis. Without volume there would be no price, so volume is just as important as price (volume is price). Think of volume as an acselerator/brake (supportive/resistive). It's not an overnight thing to master the art of volume analysis! RUDEBOY!

I would so much like to agree with you. I have spent a lot of time studying volume charts and still do, but not so much time now as before. Price can increase on high, low or no volume and can go down the same way. Heavy volume can occur, suddenly, in the middle of a trend. How is one to understand whether it is a continuance sign or we are about to experience a reversal? Or is it a sign that a reversal will take place next week? I know that heavy volume denotes interest but that is no use to me if the price does not go the way I want it. Now I prefer to leave volume out of my equation- it's a nuisance.

I've said my piece and it is not my intention to make a nuisance of myself by spoiling posters' theories. If I get converted I'll be back with some results.

Good trading

Split
 
Splitlink, what you are saying is not offensive or arguementitive and i can see what you are saying. Some charting packages do not show volume as indepth as others. Saying this, to realise volume strength is not nessecarilly a chart thing.
 
Splitlink said:
I've been through these posts more than once and have come to the reluctant conclusion that I am incapable of reading anything meaningful into volume figures .

. . .it is unlikely to be either better or worse than any mechanical method which has been reasonably backtested and is coupled with self-discipline.

Not everyone is. And if one trades something that doesn't provide "volume figures", as you call them, then he will have even more difficulty assigning meaning to something that doesn't seem to be there.

Volume "figures" are, of course, largely irrelevant to the task. As are volume bars. What does matter is trading activity, which is what volume "figures" and volume graphics are supposed to illustrate. But few people are able to get there because they attempt to learn how to incorporate the dynamics of trading activity into their trading by reading message board posts rather than by watching price and "volume" move in real time. One can post illustrative examples, as I and others have done, but regardless of whether they are examples of what happened several years ago or five minutes ago, they are by their nature hindsight. The only way to surmount this obstacle is by tracking these movements with somebody in real time in some sort of chat room or by IM or whatever.

And as for the testing, yes, of course. Only through observation and testing can one determine the truth, as opposed to hanging on some guru's every word or on what one read in a book somewhere. I'm sure you've read, for example, that one should "never short a dull market", but I've found no truth in this at all. You've probably also heard or read that one shouldn't trade at all if volume/trading activity drops below some threshold or other, but I haven't found any truth in this either.

Unfortunately, 95% of the people I've "worked" with are unwilling to do the work. And without the work, it all just lies there. But only through testing can one determine whether or not something works and why and why not. For example, there are various opposing camps with regard to the so-called "Ross Hook", which is essentially a variation on the Dunnigan One-Way Formula and nothing particularly original (though nothing during the past few decades has been particularly original), as well as Bollinger Bands, Fibonacci, "pivot points", MAs, trendlines, etc. All of these features "work" sometimes and "don't work" other times. If, however, one were to incorporate a knowledge and understanding of support and resistance into these efforts, as well as the dynamics of trading activity, he'd very likely learn much that was valuable regarding when all of this is likely to "work" and when it is not likely to do so.

Note also that one need not receive a "volume" feed in order to incorporate trading activity (which, again, is all that volume is) into his tactics. One can determine by watching price movement alone whether trading activity is lackadaisical or fevered. This can't be done in a hindsight chart, of course, but it is obvious in real time. And the point of locating potential levels or zones of S/R in advance is to enable the trader to anticipate that activity (as with the charts I posted in early May).

None of which is to say that you must understand all this in order to trade well. But you might also be misinterpreting the purpose of the work and, therefore, not seeing what is there.

Or maybe not.

--Db
 
Re: Socrates' post # 598. I'm reading along saying to myself, "yes, I remember stage one, yes, I remember stage two, um, sometimes I feel like I have reached stage three,...." well I expected there to be another 3-5 stages above that, so imagine my surprise to keep scrolling, down, down, down... Jeezsh! I haven't decided yet if this is inspiring or depressing! :eek:

Split link, I have to tell you that for me, volume made no sense until I started the journaling process, - writing down my observations, testing my theories, evaluating my results. I did not achieve the discovery of a recognizable entry setup on my first time out of the gate, and my "day job" has kept me hopping well into the night for the past 10 weeks, so I am understandably anxious to resume the process. However, the exercise of doing the journaling and creating a trading plan has opened the door a crack. I don't look at a chart the same way I used to. I've read and studied all the posts here and in the no indicators thread, had PM's with several people, but the truth is that for me, it is the journal work which precedes every advancing step I take. Reading and understanding other people's posts is not the same as recording my own thoughts and observations, and then exposing them to the scutiny of my self and others.

I now know things that I didn't before I started. I'm beginning to notice a couple of things about volume and price interaction that are not mentioned in any thread here at T2W, nor in any book I have yet to read. (My theories about these discoveries may be wrong as I have not yet had an opportunity to test them through the journal process.) I'm not suggesting that you have to use volume to trade successfully, only that I feel my left eye has been covered by a patch if I look at a chart without volume. And that I didn't begin to feel this way until I had spent 100's of hours just watching price and volume charts in real time - not trading, not anticipating or expecting anything, just watching..

Good trading to you,
JO
 
Hi db and JO,

You seem to have put your fingers on my problem. I don't watch real time charts. If that is the reason for my lack of understanding of volume then there is no solution to it. I study daily charts simply because I have no time to do otherwise. Trading is, very much, a pastime for me, although that is no reason not to be good at it, like woodwork, sailing or anything else.

That lets me out gently. I'm not as daft as I thought I was!

Split
 
Splitlink said:
That lets me out gently. I'm not as daft as I thought I was!

It doesn't have to let you out unless you want it to.

The process is practically unvarying, and unfolds according to principles that manifest themselves again and again.

For example, using the chart I posted earlier (which no one has done anything with), the first task is to locate potential S/R. In this case, "2" is potential S from the previous year (this is obviously a daily chart, but the principles apply regardless). Therefore, when price pauses at "1", one is alert to a potential reversal in advance of the test and draws a line there.

Price "rallies" slightly, but falls through that line in order to continue with the test. The trader notes the trading activity accompanying "1". When S is tested at "2", he notes that, although there is a "lower low", the trading activity is considerably less, suggesting that selling is exhausted. An aggressive trader buys here with a stop below the swing point. A less-aggressive trader waits for a retracement of some kind. This occurs just before price reaches the line drawn at "1". There may be a failure here or there may be a continuation. "Volume" doesn't provide any compelling clues one way or the other. So he looks for whatever signs of reversal he's found through his testing or he waits for a continuation, if any. Price stalls here for quite some time, so he draws a second potential R line at "3", just in case price runs into further R there.

Eventually, price breaks thru both these levels. Maybe the trader buys this BO or maybe he doesn't. His choice. Maybe he waits for a retracement, which occurs shortly thereafter when price returns to R become S at the line drawn at "3". He then draws the next potential R line at the most recent swing high.

Trading activity, or "volume", is relatively quiet throughout, demonstrating yet again that powerful volume is not required for substantial moves. All that is required for substantial upside is a lack of selling interest, clearly evident here due to the fact that price can rise without much effort.

These are the same principles I've stated again and again with multiple examples. There are only a handful, and they quickly become repetitive. There's no mystery. Nothing labyrinthine. One only has to trade what he sees without bias as to what he thinks or "believes" should be or ought to be or has to be.

--Db
 

Attachments

  • Waves01SR.gif
    Waves01SR.gif
    4.3 KB · Views: 1,784
And another.

Price breaks through that swing high from the retracement to "3", retraces a bit, but doesn't even make it all the way back to the line, suggesting a preponderance of buying pressure over selling pressure. "Volume", again, is not enormously compelling one way or the other. One has to focus on price. Since there's no important S/R here, there's no reason to expect a lot of trading activity, though one must be open to any eventuality.

Price continues all the way up to a December high with no "volume" spikes. However, when an attempt at a higher high is made, traders aren't interested. The fact that the activity reflects the holiday is irrelevant. Price doesn't make a new high, and that's that. It then begins a precipitous decline and trading activity at last increases, suggesting that sellers are at last coming into the market and overwhelming demand.

Same principles as always.

--Db
 

Attachments

  • Waves02SR.gif
    Waves02SR.gif
    7.4 KB · Views: 1,747
dbphoenix said:
It doesn't have to let you out unless you want it to.

The process is practically unvarying, and unfolds according to principles that manifest themselves again and again.

For example, using the chart I posted earlier (which no one has done anything with), the first task is to locate potential S/R. In this case, "2" is potential S from the previous year (this is obviously a daily chart, but the principles apply regardless). Therefore, when price pauses at "1", one is alert to a potential reversal in advance of the test and draws a line there.

Price "rallies" slightly, but falls through that line in order to continue with the test. The trader notes the trading activity accompanying "1". When S is tested at "2", he notes that, although there is a "lower low", the trading activity is considerably less, suggesting that selling is exhausted. An aggressive trader buys here with a stop below the swing point. A less-aggressive trader waits for a retracement of some kind. This occurs just before price reaches the line drawn at "1". There may be a failure here or there may be a continuation. "Volume" doesn't provide any compelling clues one way or the other. So he looks for whatever signs of reversal he's found through his testing or he waits for a continuation, if any. Price stalls here for quite some time, so he draws a second potential R line at "3", just in case price runs into further R there.

Eventually, price breaks thru both these levels. Maybe the trader buys this BO or maybe he doesn't. His choice. Maybe he waits for a retracement, which occurs shortly thereafter when price returns to R become S at the line drawn at "3". He then draws the next potential R line at the most recent swing high.

Trading activity, or "volume", is relatively quiet throughout, demonstrating yet again that powerful volume is not required for substantial moves. All that is required for substantial upside is a lack of selling interest, clearly evident here due to the fact that price can rise without much effort.

These are the same principles I've stated again and again with multiple examples. There are only a handful, and they quickly become repetitive. There's no mystery. Nothing labyrinthine. One only has to trade what he sees without bias as to what he thinks or "believes" should be or ought to be or has to be.

--Db
The first clump of volume as indicated is accumulation, and not a test.
The price is allowed to fall further, it is then re accumulated again.
This time the volume is less.
This is because there is less available.
Then it begins to lift owing to artificial shortage caused by this previous accumulation in two phases, which is a campaign or the end of a campaign to accumulate it.
The volume required to lift it is not great for this reason.
This is why the volume declines even as the price goes up.

Where does testing come into it ?
 
I'd like to clarify something I said earlier. Most of my "aha!" moments have not come during the journal process. But I believe that all of my "aha!" moments have come as the result of doing the journal process. And of course, once one has the germ of an idea, then it's back to the journal process for testing.
JO
 
Thanks a lot for your interest. I do use your explanation as a search for double bottoms, already,
but your posts have been helpful in getting my thoughts together on the volume angle, which have been unsuccessful to date.

I'll be back when I have a traded example, along with a chart. In the meantime, I'm reading the posts.

Regards Split
 
An example of using "sister" instruments to aid in making a trading decision. In this case, while the NQ is making a double-bottom, the ES and YM are making higher lows.
 

Attachments

  • Cross.gif
    Cross.gif
    9.4 KB · Views: 443
And this is something that is very relevant for my type of trading approach:

An example of using "sister" instruments to aid in making a trading decision. In this case, while the NQ is making a double-bottom, the ES and YM are making higher lows.

Yes, and what happens when each of them go in opposite directions to each other ?

Do you go and make a special rules for such?

Thanks
 
Last edited by a moderator:
contrakt said:
Yes, and what happens when each of them go in opposite directions to each other ?

Do you go and make a special rules for such?

Thanks

I think a better question might be is
"how often does the bottoming process fail when all three indexes are going through the the process at the same time"?
Is there an edge when this happens?
 
Market maker X receives a call to buy him 10 000 GOOG @ 50 C below yesterday VWAP

DOW is Strong .. .

Market maker is to fill the order .. He drops the price to below yesterday’s support.. sellers move in .. A volume trader sees this as a bearish sign .. MM fills the order and runs the stock up to match the market direction ..

Now guys,

If you was a volume/ Price trader how would you know MM is a potential Bull than a bear on the stock ..?

Most trading activities amongst bank traders revolve around VWAP ……This is the most trust able bench mark for big boys..
This is what we use as a bank trader.
Speak to your broker about VWAP levels and how they work their mass orders through this highly important bench mark …

So how come none of you guys do not even bring VWAP into your volume / price analysis ?

Grey
 
SOCRATES said:
Grey one, how do you reasonably expect anyone to consider Volume Weighted Average Price considering the difficulties already encountered with the most simple, basic, rock bottom principles under discussion ? Please !


Socrat,

VWAP is a rock bottom concept...

I have outlined more advanced side of VWAP hedging/ arbitrage trading in my earlier posts if you care to read them . ( advanced VWAP strategies are not needed for successfull trading )


I
 
Grey one, I agree totally with you. And I will make a point of reading your earlier posts. But I am waiting for an answer to a legitimate question, that is not a trick question or a joke and ultimately, if I do not get the correct explanation in detail, I will proceed to provide it in meticulous detail as promised for everybodys' benefit and to my satisfaction.
 
Last edited by a moderator:
Grey1,

I am not familiar with the use of VWAP. If it is an indicator derived from price and volume (and as the emphasis of this thread is generally about trading without indicators), it would be interesting to know if you think that the information VWAP conveys could be seen by an experienced trader viewing only price/volume charts of a particular instrument.

I ask as one of the main premises of indicator free trading is that one is trading from raw data, and that any indicator derived from that is therefore by definition lagging. Could you do what you do without VWAP? Just curious.
 
it would be interesting to know if you think that the information VWAP conveys could be seen by an experienced trader viewing only price/volume charts of a particular instrument.

It may be possible to some degree but using vwap to trade also requires using maximum permissible deviations and this would be quite difficult to discern using price and volume patterns on their own.


Paul
 
Top