Price, (Volume), Support, Resistance, Demand, Supply . . .

Swing High

dbphoenix said:
I'll try to attach a couple pdfs on this. Odd that there's no guidance on file size.

DP,

A while back you included a couple of pdfs on swing highs that were written by Walter Bressert. I am looking for " basic " info like this on PV, is this availble in a book? Your Demand/ Supply info also.

Thanks

Steve
 
buying and selling pressure

Hi Dph,

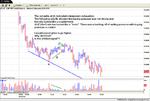
I have attached a chart with some notes and a Question.
Can u comment??

The way I see buying pressure and selling pressure is as a "momentum of price movement",
as "the ease of movement" and path of least resistence.
Ways this shows on a chart are , price bar crossover, bozos, dojis etc.

Am I on the right track??

The question I have asked on the chart is about the possiblity of the buying/selling pressure
dynamic giving a failed signal.
Can u comment on what I have written on the chart.

Many thanks Roelof
 

Attachments

  • CHART 7.png
    CHART 7.png
    96.4 KB · Views: 1,874
rhk said:
Hi Dph,

I have attached a chart with some notes and a Question.
Can u comment??

The way I see buying pressure and selling pressure is as a "momentum of price movement",
as "the ease of movement" and path of least resistence.
Ways this shows on a chart are , price bar crossover, bozos, dojis etc.

Am I on the right track??

The question I have asked on the chart is about the possiblity of the buying/selling pressure
dynamic giving a failed signal.
Can u comment on what I have written on the chart.

Many thanks Roelof


Going over this stuff in hindsight is easy because one can say Oh, well, of course. However, I agree that you were right to at least hypothesize that selling was becoming exhausted, not so much because of the price bar since it closed at the low, but rather because of the quick rebound in the next bar. If you have the option of showing ticks, this may be easier for you to see if you toggle your chart to them. Focusing on "bars" can be a trap as it encourages you to think of them as indicators rather than arbitrary divisions of time.

And you are correct about the lack of enthusiasm for the rally. Note that there is a zone of trades from 0940 to 1030/35. This is where the subsequent rally stalls. However, it's important to understand that demand is not sufficient to push price past this zone, regardless of the number of buyers. In other words, low volume in and of itself is not the determining factor. In the end, the buying pressure apart from the number of buyers is insufficient to push price past that zone. That plus the lack of buyers kills the movement.

As for your bar C, avoid making too much of any given bar. This bar will exist as such only in this particular bar interval. If you were to use a 1m chart or 10m chart, it would look quite different. Having said that, the bar is not a bozo since it doesn't close at the high. Instead, it fails to hold at the high and drops back to that zone. If the pressure were on the buyside, it is here that it would most likely show itself. Instead, price waffles around and fails.

As for the "failed signal", I can't provide an answer since I don't know what you're using for signals, so I can't say whether there is a signal failure or not. What I see is that buyers can't push price past 17, much less reach the opening high. This creates a lower high, moving the pressure to the sell side. It would be difficult to fault using this as a "signal" to go short.
 
Roelof,
Here is the same chart from a longer viewpoint. Iv'e circled the area you were discussing. These are the areas I find most difficult to trade. When in doubt, I look at a longer view chart to make sure I understand the overall trend. (Is this really a reversal, or just a resting spot on the way further down?) I remind myself that it takes a long time to turn a tanker at sea, and the faster the previous speed, the longer it takes.

Even so, I still get these areas wrong fairly often.
JO
 

Attachments

  • ESSept22.jpg
    ESSept22.jpg
    36.7 KB · Views: 578
JumpOff said:
(Is this really a reversal, or just a resting spot on the way further down?)

Why do you have to choose? If you've defined what you call a reversal and the actiion satisfies your criteria, then trade it. If it turns out to be a continuation instead, trade that. Why all the angst?

Higher lows, lower highs, double tops, double bottoms, trendlines.

Very simple.
 
dbphoenix said:
Why do you have to choose? If you've defined what you call a reversal and the actiion satisfies your criteria, then trade it. If it turns out to be a continuation instead, trade that. Why all the angst?

Higher lows, lower highs, double tops, double bottoms, trendlines.

Very simple.
That really made me laugh, thanks dbp.

It is so easy to get caught up in something, anything, other than trading what you see.

I'm just wondering why keeping it simple is oftentimes so hard?
 
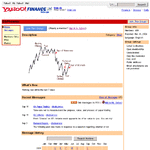
dbphoenix - when I go to your Yahoo Groups page I see the page shown in the first graphic - yahoo1.gif. When I click on individual months to see messages in them I always get the same 3 messages as in yahoo2.gif. E.g. I want to see the 7 posted in May but instead I get the 3 most recent ones. Is it broken or am I doing something wrong?

EDIT - forgot to add - and the previous/next links to navigate through the messages are not links.

Thanks,
cab
 

Attachments

  • yahoo1.gif
    yahoo1.gif
    24.1 KB · Views: 512
  • yahoo2.gif
    yahoo2.gif
    36.1 KB · Views: 439
Last edited:
dbphoenix said:
If the pressure were on the buyside, it is here that it would most likely show itself. Instead, price waffles around and fails

Hi Dph,

Thanks . I've highlighted ,in your reply, the comment that answers what I was trying to ask.
Thats what I meant by failed signal. Do u use this failure as a trigger to go short.?
In my chart ,pt. C seems to be where early-bird shorts with tight stops got taken out and then the mkt went down. Seeing that buying pressure failure, would that be a logical place to go short?
Could one expect a bigger move with that buying pressure failure??

Again, thanks, I've learnt much.
Roelof
 
rhk said:
Hi Dph,

Thanks . I've highlighted ,in your reply, the comment that answers what I was trying to ask.
Thats what I meant by failed signal. Do u use this failure as a trigger to go short.?
In my chart ,pt. C seems to be where early-bird shorts with tight stops got taken out and then the mkt went down. Seeing that buying pressure failure, would that be a logical place to go short?
Could one expect a bigger move with that buying pressure failure??

Again, thanks, I've learnt much.
Roelof

That's where the rubber meets the road and the beginner stops being a beginner. It's up to you to find similar "patterns" in other charts, determine why price sometimes reverses and sometimes resumes the original direction, determine where the best entry is that will make the probability of a reversal high enough for you, determine the narrowest stop you can use without getting shaken out (and the conditions under which you'd take the opposite side of the trade, i.e., fade yourself), determine what the most reasonable price target is. Then forward-test it using old charts, then paper-trade it in real time.

Seems like a lot of work to answer what may appear to be a simple question, but that's what it takes to gain confidence in your abilities as a trader.
 
dbphoenix said:
That's where the rubber meets the road and the beginner stops being a beginner. It's up to you to find similar "patterns" in other charts, determine why price sometimes reverses and sometimes resumes the original direction, determine where the best entry is that will make the probability of a reversal high enough for you, determine the narrowest stop you can use without getting shaken out (and the conditions under which you'd take the opposite side of the trade, i.e., fade yourself), determine what the most reasonable price target is. Then forward-test it using old charts, then paper-trade it in real time.

Seems like a lot of work to answer what may appear to be a simple question, but that's what it takes to gain confidence in your abilities as a trader.

I've been a beginner for a long time .... ;)
You mentioned tik charts .. Do u use them much?.
I have never looked at them.

Also, do u watch specific time frames?? eg. 5min, 15 min chart etc
Just asking to try to see how u look at what is behind each individual bar on a chart , to
percieve buying/selling pressure.
I understand that u sometimes merge 2 bars , for example on a 5 min chart, to get a clearer
sense of buying/selling pressure.

U have helped me on the path to doing some useful study.
I have wasted alot of effort in the past learning wrong things

cheers Roelof
 
I use 1m and 5m charts. I've looked at tick charts and don't find them particularly helpful, but that doesn't mean that they aren't. If you find them helpful, then use them.

Edit: I've changed my view on this after experimenting for several months and find that both ticks and time have something to offer, particularly when trading activity slows and volatility contracts, a particular problem since January. Therefore, I use tick charts rather than the 1m.
 
Last edited:
Where to go next

Dear Pdp,

Excellent thread. I've been working my way through it and have learnt a lot. I realise that a lot of your knowledge has been gained from experience but as a beginner I would appreciate suggestions of any books that might help me get started along the road of Price and Volume. I'm currently reading “Undeclared Secrets that Drive the Stock Market” but would appreciate a suggestion of what to read next.
 
rhk said:
The way I see buying pressure and selling pressure is as a "momentum of price movement",
as "the ease of movement" and path of least resistence.
Ways this shows on a chart are , price bar crossover, bozos, dojis etc.

Dear rhk,

Can you explain what a bozo pattern is as I know all the usual candlestick names but don't recognise that one. I did a search of the t2w website and its not used anywhere else. Also, I could not open your chart as I don't recognise the png file extension so I could not find out what a bozo is from their either.
 
JungleJim said:
Dear Pdp,

Excellent thread. I've been working my way through it and have learnt a lot. I realise that a lot of your knowledge has been gained from experience but as a beginner I would appreciate suggestions of any books that might help me get started along the road of Price and Volume. I'm currently reading “Undeclared Secrets that Drive the Stock Market” but would appreciate a suggestion of what to read next.

Given the emphasis on indicators over the past thirty years, there's very little available on PV, and what is available is for the most part no longer in print. There is a reading list at the Yahoo site (http://groups.yahoo.com/group/DbPhoenix/) that may be of help.
 
Last edited:
JungleJim said:
Dear rhk,

Can you explain what a bozo pattern is as I know all the usual candlestick names but don't recognise that one. I did a search of the t2w website and its not used anywhere else. Also, I could not open your chart as I don't recognise the png file extension so I could not find out what a bozo is from their either.

http://www.trade2win.com/boards/showpost.php?p=105035&postcount=861
 
Bozo

Dear All,

Thank you. I did not realise Bozo was short for "marubozu" but it makes sense because it is a bit of a mouthfull.
 
dbp,

I've being quitely lurking for a while, but since things have died down a bit so I thought I'd chip in...

I've spent many weeks reading everything you've written and I often find myself thinking ' If he's half as good a trader as a writer, he must be living on a desert island somewhere in the Carribean.'

But somehow I know you're not (living in the Carribean that is), and I bet wealth is not your main motivation.

Rather I assume being a superior trader is your goal, as it is mine and I'm sure many others feel the same.

You have changed your trading style a few times, at one time being an CANSLIM follower, now a Wyckoff master, I'd love to know how and why you've changed, and I'd find a narrative of your journey very useful, maybe others would too ?

I think many people who start trading HOPE that its possible to become consistently profitable, some may even BELIEVE they can, my question is, as a master of the art, what do you believe and why ?


Thank you for your contributions and unselfish giving, and long may it continue.

Porks.
 
Porks said:
dbp,

I've being quitely lurking for a while, but since things have died down a bit so I thought I'd chip in...

I've spent many weeks reading everything you've written and I often find myself thinking ' If he's half as good a trader as a writer, he must be living on a desert island somewhere in the Carribean.'

But somehow I know you're not (living in the Carribean that is), and I bet wealth is not your main motivation.

Rather I assume being a superior trader is your goal, as it is mine and I'm sure many others feel the same.

You have changed your trading style a few times, at one time being an CANSLIM follower, now a Wyckoff master, I'd love to know how and why you've changed, and I'd find a narrative of your journey very useful, maybe others would too ?

I think many people who start trading HOPE that its possible to become consistently profitable, some may even BELIEVE they can, my question is, as a master of the art, what do you believe and why ?


Thank you for your contributions and unselfish giving, and long may it continue.

Porks.


There's a file at my Yahoo site called The Journey. By this time, I've taken all three routes.

As for what I believe, could you be a bit more specific? (I assume you don't mean that for every drop of rain that falls, a flower grows or that Republicans are inherently evil . . . )
 
dbp:

I have a belief that anyone who's prepared to put in the work can be consistently successful at this game.
This only really came alive for me when a work friend of mine was made redundant a few years back, started trading and has since done extremely well (A simple method that fits him, but feels too risky for me).
Since you've been trading for a few years and seem to have a better knowledge about the markets than anybody, do you also believe that anyone can also be a consistently profitable trader ?
Given the time/effort you've invested over the years, would you do it all again ?

Because despite my belief, I have this nagging feeling that sure, some traders are successful, even for quite long periods of time. but ultimately they all end up going through periods of devastation, and most never recover. I'm thinking of the usual brigade of Livermore, Trader Vic, and other vendor/guru's.

It doesn't help that I've never met a trader who isn't interested in learning about yet another method and jump at the chance to discover the latest secret. If they were so sure of what they are currently doing, why bother ?

Its a well quoted fact that 90-95% of traders don't make it (not that bad when you consider its about the same attrition rate of new businesses), but in reality isn't closer to 99.8% that wash out sooner or later ?


Porks
 
Top