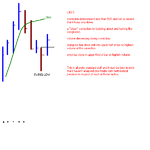
I may do this a little later on but will wait and see first how this discussion turns out. But, as an aid simply draw 2 daily bars side by side with open and close ticks and apply what has been said thus far. I think it will become quite visually obvious. I do understand that there are visually oriented learners. I learn better with just facts and numbers..etc but at the appropriate time I will possibly attempt to make the concepts visual. But I wish for this to develop a little more first, if in fact there is enough interest to keep it going.There are many things that can be measured....timsk said:Hi pttrader,
😱
On behalf of all the dumbos who are trying to follow your posts but can't quite keep up with the pace, any chance of posting an annotated chart illustrating the points you're making? I'd really appreciate it and I'm sure others would too. 😀
Cheers,
Tim.
PT