price action

was better today , but maybe my stop should have been wider ?
i moved my stops down and it worked great ,got about 35 pips.
3019700032_7d69f26c08_o.png
 
Hey price777999,

Are you paying attention to bar/candlestick patterns/setups?

If not, take a look at them, as they are an excellent way to determine the price action.

no i haven't got the hang of candles yet , im just using the tick chart and zooming out .

im looking at stochastics on higher time frames to help gauge which way it will go .

do you draw lines on the shadow or the body ?
 
One minute charts show good rejection levels. Ie where you drew your resistance line. They are pretty good for showing trends in short term time frames which makes it easy to get a breakout and get in at reversal points.

However, they should not be used for candle stick patterns imo. Unless you see 4 doji's in a row or something. Of course, this doesn't mean they can't be used for that reason.

Take care,

Phil.
 
price777999,

Your FTSE sell looks like it was right into support from what I can see of your post.

What got you into your Euro trade? Tell me you weren't going to be a buyer simply because price broke out of a trendline on the tick charts?! And if you were...you shouldn't have taken a loss after you got a few pips on the table...

Here are my setups from today in both those respective markets.

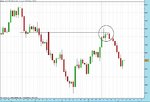
First one in the FTSE was a pin bar showing rejection of Fridays high and a minor support/resistance pivot.

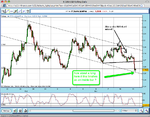
Second one in the Euro showed an inside bar formation at an hourly support/resistance pivot.

I only trade hourly charts and pick my trades very carefully.
 

Attachments

  • ftse.jpg
    ftse.jpg
    137.6 KB · Views: 387
  • euro_hourly.gif
    euro_hourly.gif
    21.8 KB · Views: 371
price777999,

Your FTSE sell looks like it was right into support from what I can see of your post.

What got you into your Euro trade? Tell me you weren't going to be a buyer simply because price broke out of a trendline on the tick charts?! And if you were...you shouldn't have taken a loss after you got a few pips on the table...

Here are my setups from today in both those respective markets.

First one in the FTSE was a pin bar showing rejection of Fridays high and a minor support/resistance pivot.

Second one in the Euro showed an inside bar formation at an hourly support/resistance pivot.

I only trade hourly charts and pick my trades very carefully.


Hi TD, well done on the trades however to me that sell on the eur/usd didn't look overly attractive considering the higher highs, higher lows since friday a.m and a pivot at 12890. Just wondered what made you take that as an IB trade? Were you very bearish on it anyway prior?
 
Hi TD, well done on the trades however to me that sell on the eur/usd didn't look overly attractive considering the higher highs, higher lows since friday a.m and a pivot at 12890. Just wondered what made you take that as an IB trade? Were you very bearish on it anyway prior?

Hi barryb, I don't take higher highs, higher lows etc into consideration...a trend can change at any time...why not there?

It was a consolidation at a s/r pivot offering a good r:r. That is enough to get me in a trade.
 
What got you into your Euro trade? Tell me you weren't going to be a buyer simply because price broke out of a trendline on the tick charts?! And if you were...you shouldn't have taken a loss after you got a few pips on the table...

yes mate iv only been trading for a few weeks , i was looking at stochastics on a higher time frame and thought it was gona turn around.

Your FTSE sell looks like it was right into support from what I can see of your post.

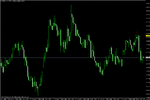
yes it was really i think i entered when it started bunching up at the bottom of the channel and after briefly breaking below the support line.

it looks like you took the same trade ....did you enter on the hour chart ?.....how big was your stop ?
 
Hi barryb, I don't take higher highs, higher lows etc into consideration...a trend can change at any time...why not there?

It was a consolidation at a s/r pivot offering a good r:r. That is enough to get me in a trade.

Fair enough, depends on your views regarding past price action which is another subject completely. Where did you get out of it just out of interest?
 
Fair enough, depends on your views regarding past price action which is another subject completely. Where did you get out of it just out of interest?

Get out?! I'm still holding...looking to build a real position ahead of 123.00.
 
Best of luck, i'll be watching with interest.

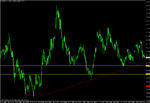
If we get through these support areas then the lows are a given...and then I think we could make it as low as 1.1875.

That would be where I would really want to build on it for a drop to 1.0875...then the plan is add more for a test of 1.0200 and then add more for a run on 0.9600.
 

Attachments

  • euro.gif
    euro.gif
    25.8 KB · Views: 384
price777999,

Your FTSE sell looks like it was right into support from what I can see of your post.

What got you into your Euro trade? Tell me you weren't going to be a buyer simply because price broke out of a trendline on the tick charts?! And if you were...you shouldn't have taken a loss after you got a few pips on the table...

Here are my setups from today in both those respective markets.

First one in the FTSE was a pin bar showing rejection of Fridays high and a minor support/resistance pivot.

Second one in the Euro showed an inside bar formation at an hourly support/resistance pivot.

I only trade hourly charts and pick my trades very carefully.


I made the same trade on the EUR/USD but I didn't use the indide bar, a nice cycle just happen to come out right there as well. I did get out already as I had to come to work🙁.
Oh and i did trade the gap as well.🙂
 
yes mate iv only been trading for a few weeks , i was looking at stochastics on a higher time frame and thought it was gona turn around.

Don't think and guess, wait for price/indicator or whatever to confirm your thoughts, you may miss a few points at the start of a move but should get into less fakes
 
Back
Top