Everyone knows the market data are fractal. You can look at a chart of daily data, look at a chart of weekly data, and the charts basically look the same if the scales are removed. In other words, the amplitude of the cyclic swings scale in direct proportion to the cycle period. I call this effect Spectral Dilation because longer cycle periods have larger swings. The Hurst Coefficient is directly related to the degree of dilation. Fibonccians use the Golden Spiral to show the dilation factor is 1.618. The exact degree of dilation is not important. The fact that dilation exists is beyond question. So, in round numbers, the spectrum amplitude increases 6 dB per octave of cycle period. This “1/F” phenomena seems to be almost universal in physical systems.
Here was my epiphany regarding market data: Like everyone, I knew the market data was fractal. However I completely disregarded this fact when looking at oscillator type indicators such as the Momentum, Stochastic, RSI, MACD, or CCI. In a nutshell, all these indicators are first order differentiators. That is, they all take just one difference in their calculation. A basic principle of filtering is that simple differencing has an attenuation rolloff of 6 dB per octave per order of the filter in the attenuation band of the filter. Therefore, all of these indicators roll off at the rate of 6 dB per octave like a simple HighPass filter. Since the data amplitude swings are increasing at the rate of 6 dB per octave, the best these indicators can do is to flatten the response of the data spectrum in the indicator output.
Figure 1 shows the practical effect of a simple HighPass filter when applied to some sample market data. Note that during the period of the long uptrend the oscillator does not have a zero mean. That is, the wiggles are not centered on zero. The interpretation is that the data has not been fully detrended and that the longer cycle period signals are “leaking through” the rejection band of the filter.
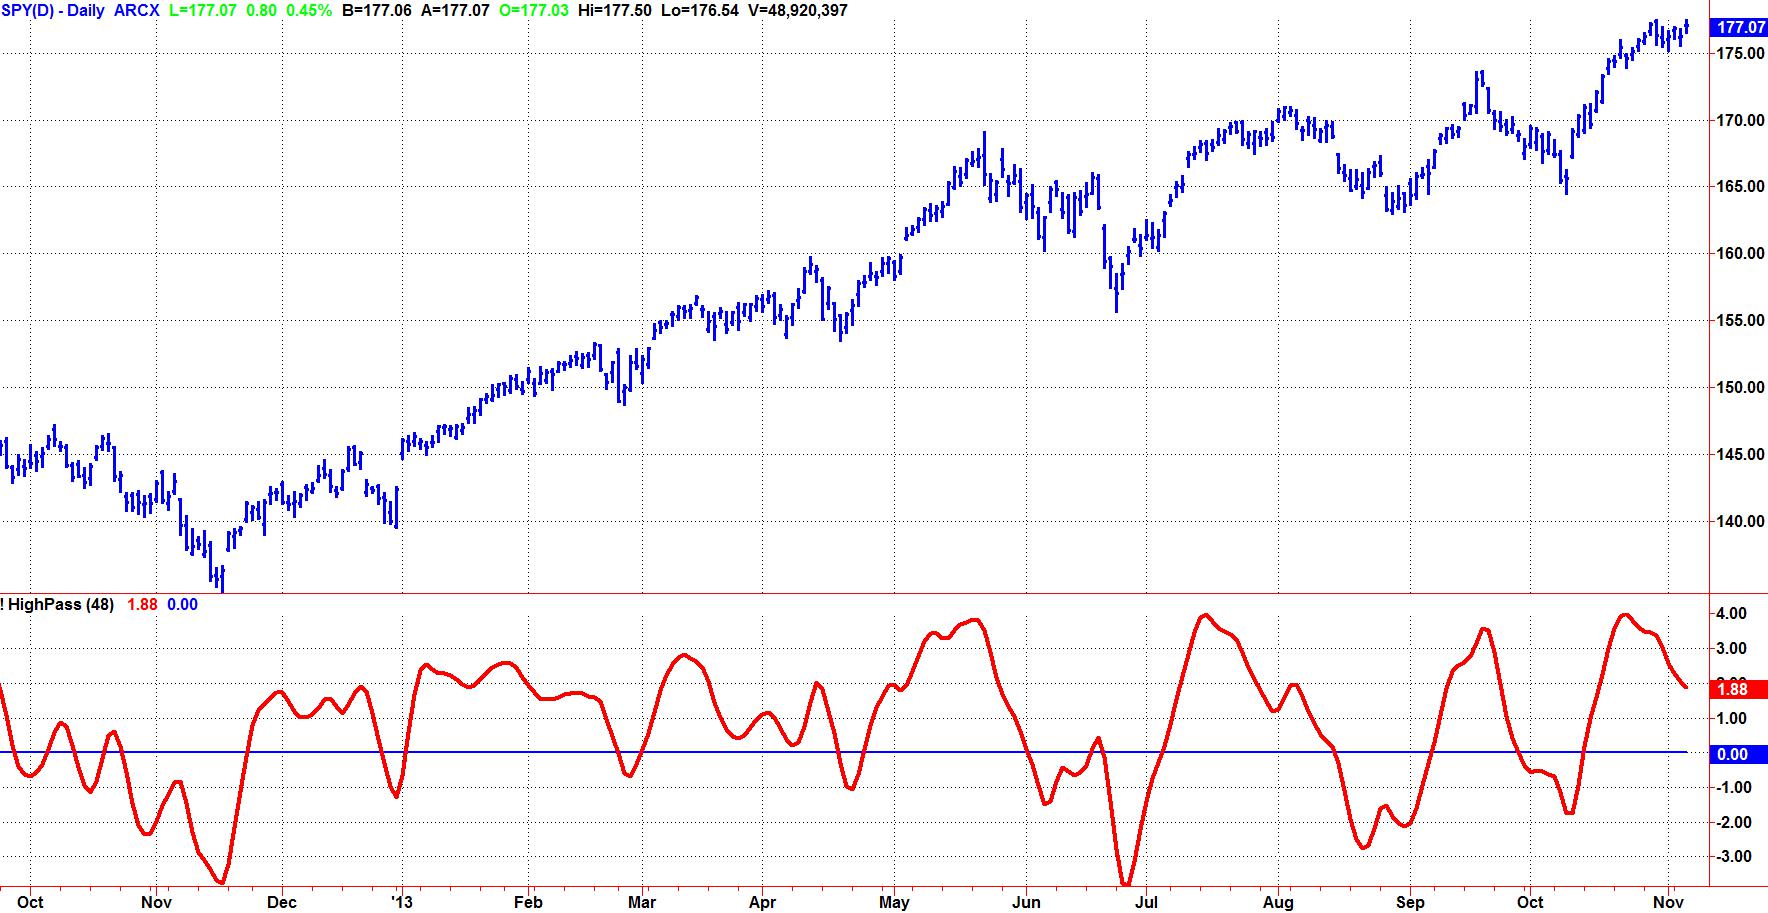
Figure 1. A Simple HighPass Filter Does Not Accommodate Spectral Dilation
The attenuation rate is increased 12 dB per octave in the attenuation band by using a second order HighPass Filter. The filter attenuation exceeds the 6 dB per octave Spectral Dilation in the data and therefore effective filtering of the longer cycle components is accomplished. Figure 2 shows the contrast between using a first order HighPass filter and second order HighPass filter. The dotted red line is the original response given in Figure 1 and the solid blue line is the second order response. Note the second order response provides a nominal zero mean for the oscillator and that much of the lag induced by the “leaking” longer cyclic components is eliminated.
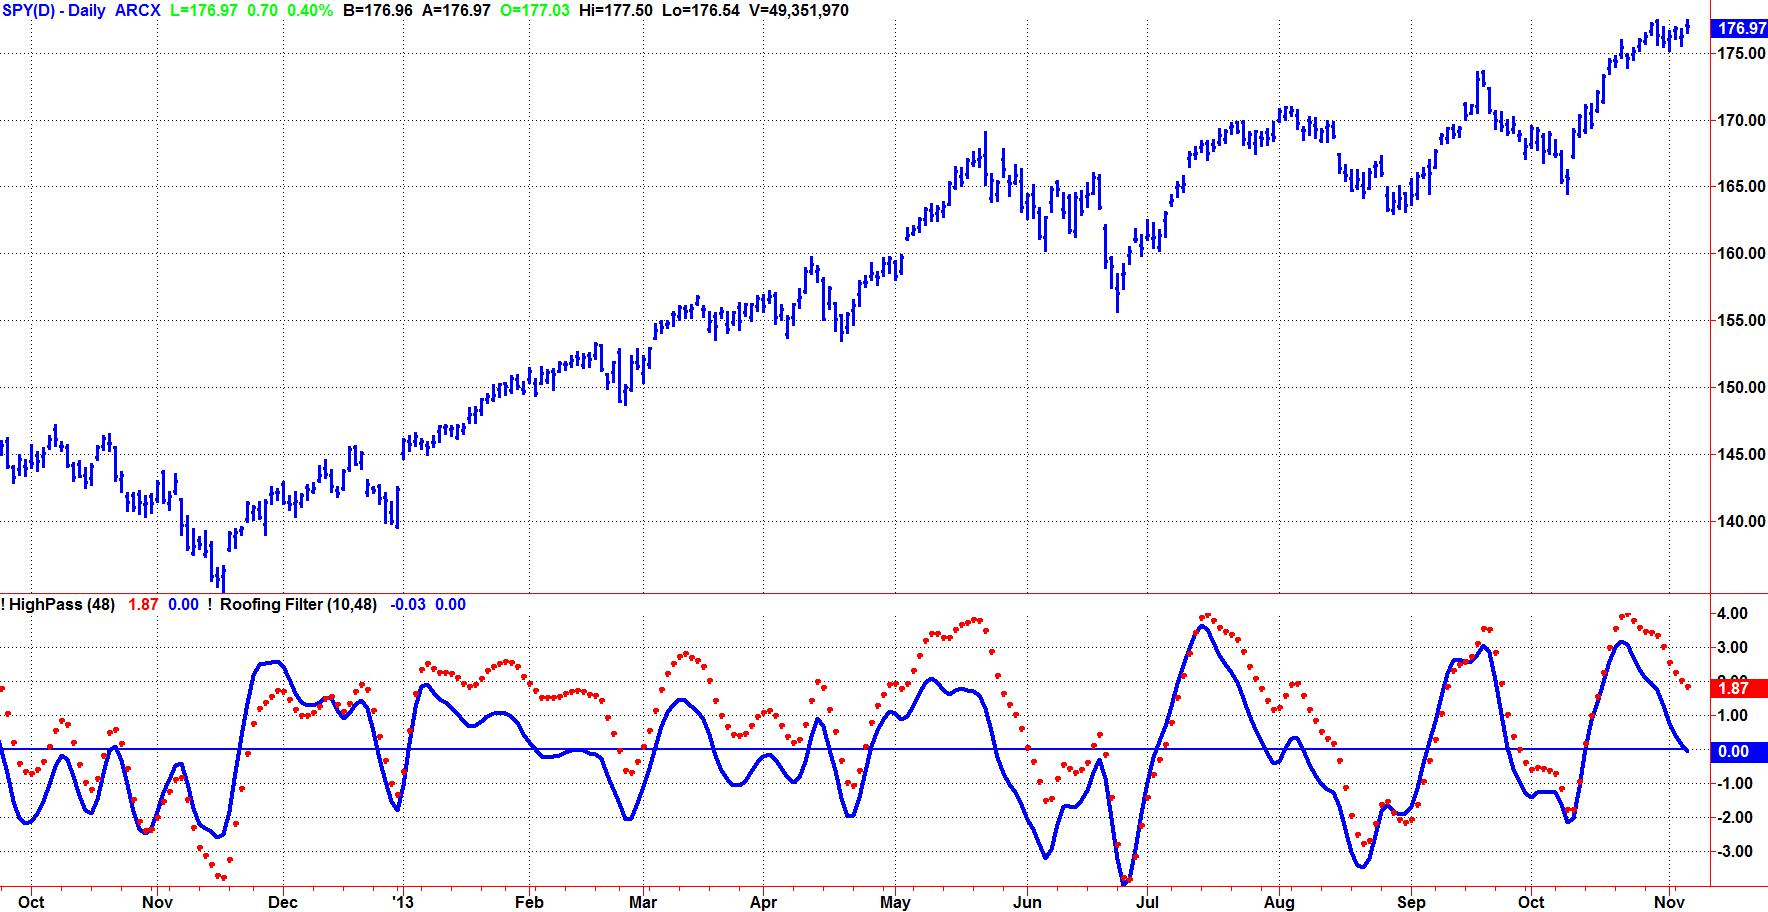
Figure 2. The Second Order HighPass Filter Establishes a Zero Mean and Reduces Lag of the Oscillator
I call the combination of my SuperSmoother filter and the second order HighPass filter a “Roofing Filter” because it provides a roof over the data spectrum so the data is preprocessed for use with any indicator that may follow. The Roofing filter is not a bad indicator in its own right. In a sense, the Roofing filter is a kind of BandPass filter. The Roofing filter differs from a BandPass filter because the rejection response on the high frequency side is specifically designed to reject aliasing noise and the second order rejection response on the low frequency side is specifically designed to eliminate the effects of Spectral Dilation.
The MESA Stochastic is just a standard Stochastic calculation preceded by a Roofing filter, and is just one example of the use of the Roofing filter. The two indicators are compared in Figure 3. I rememberGeorge Lane, a bombastic speaker, list the myriad of rules in the use of the Stochastic. Some depended on %D crossing %K on the right side or left side. Also one rule was “In an uptrend, don’t go short until %D crossed below 80 three times”. As we now see, all those rules are just plain silly. The distortion of the Stochastic in an uptrend is due solely to Spectral Dilation. When the Roofing filter precedes the Stochastic, the result is an easy-to-use oscillator whose swings are nearly in synchronization with the swings in the prices.
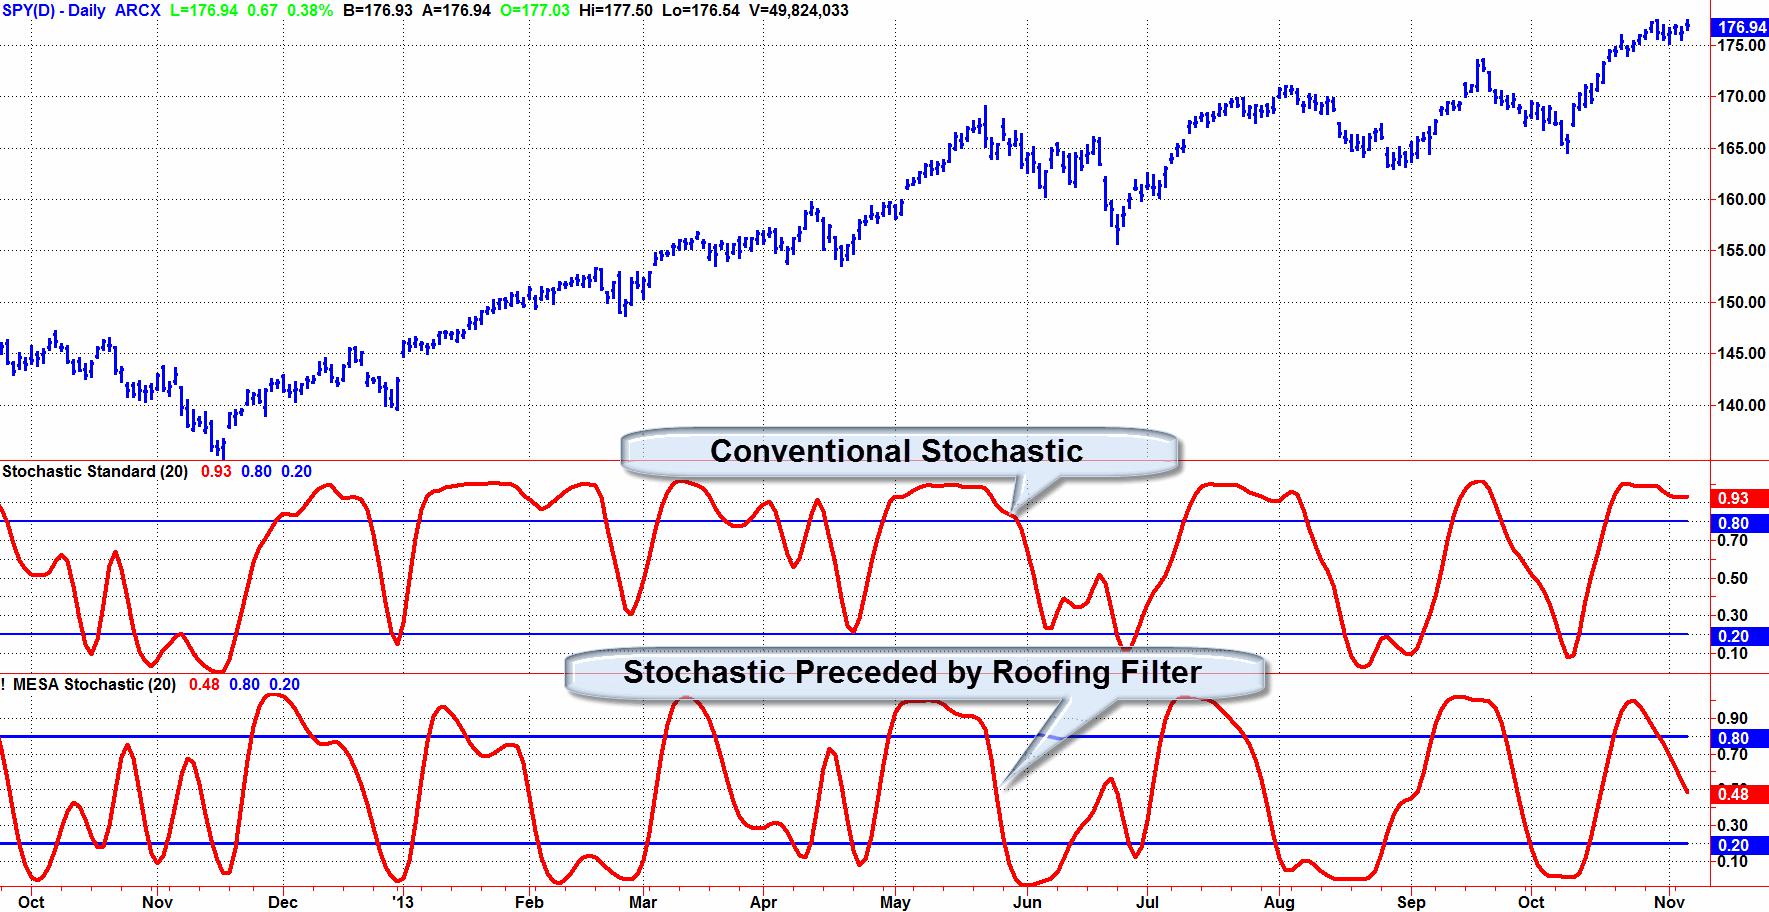
Figure 3. Roofing Filter Removes Spectral Dilation Effects from Indicators
Figure 4 shows how the MESA Stochastic would be used with conventional wisdom. Conventional wisdom says to wait for confirmation of the turning point before making a trade entry. That translates to rules that say “Buy when MESA Stochastic crosses over 20” and “Sell Short whenMESAStochastic crosses under 80”. The green and red arrows indicate application of those rules.
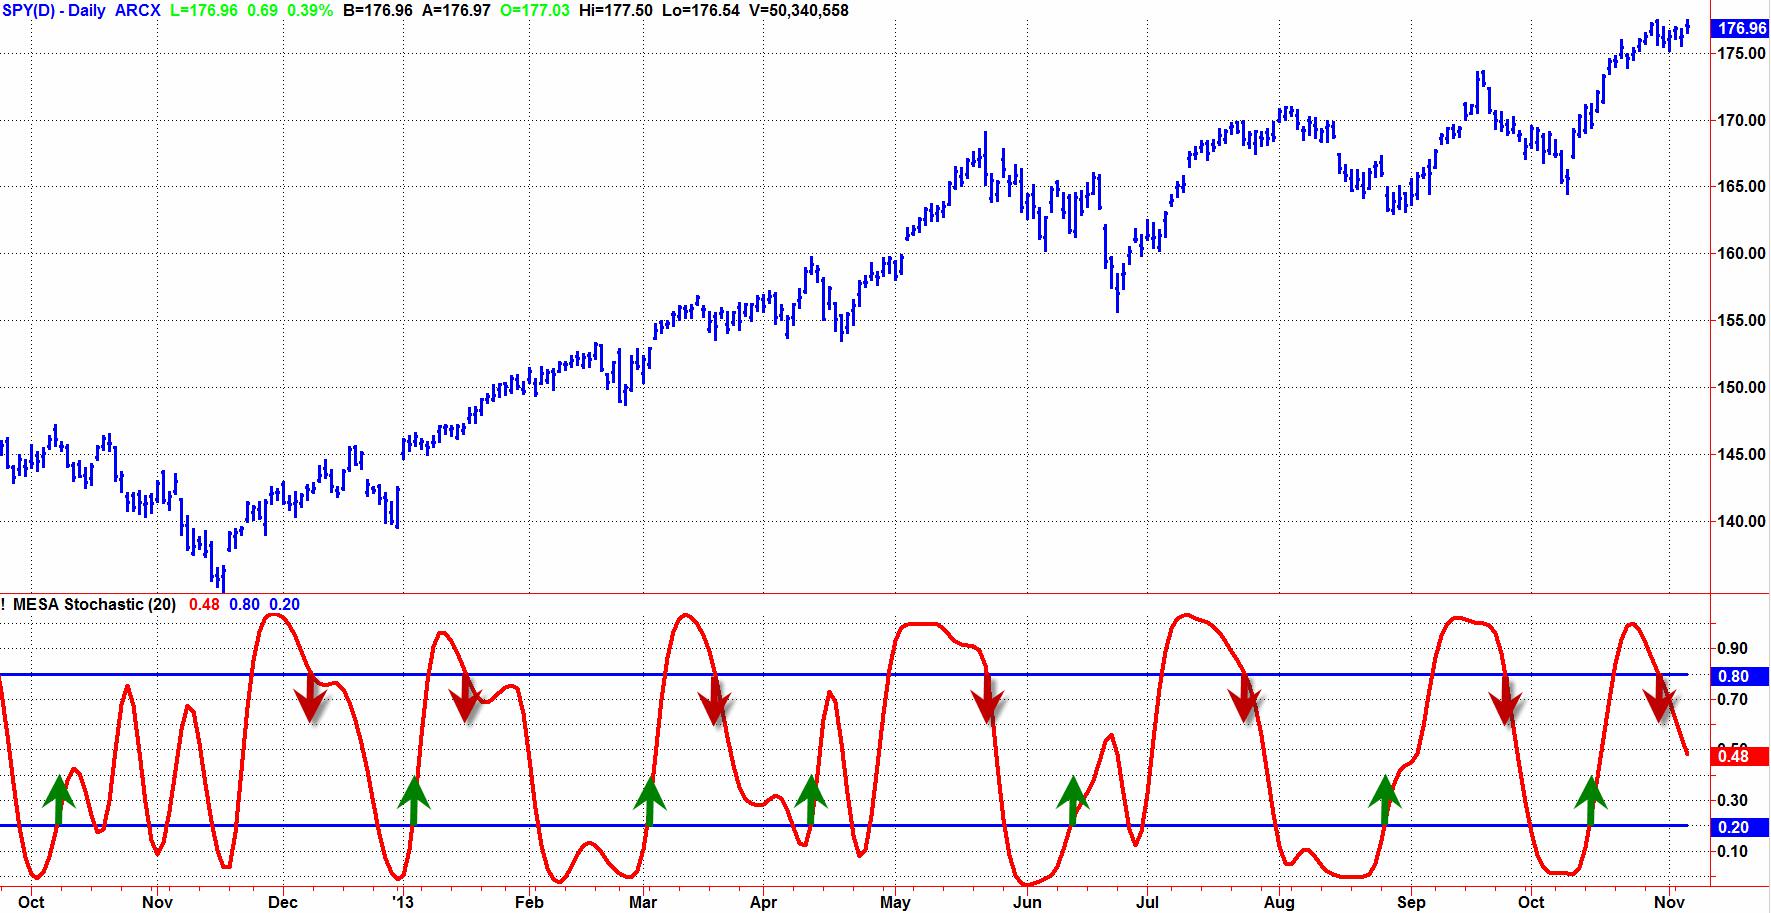
Figure 4. Conventional Wisdom Says to Wait for Confirmation Before Making a Trade Entry
A casual review of those rules seem to confirm they are good rules. Not trusting anecdotal evidence, I wrote a trading strategy that contain ONLY those rules. There were no other qualifying rules and no stop exits. When I ran that trading system on 10 years of continuous ES daily data I got the Equity Growth Curve shown in Figure 5. The trading system using conventional wisdom was a consistent loser!
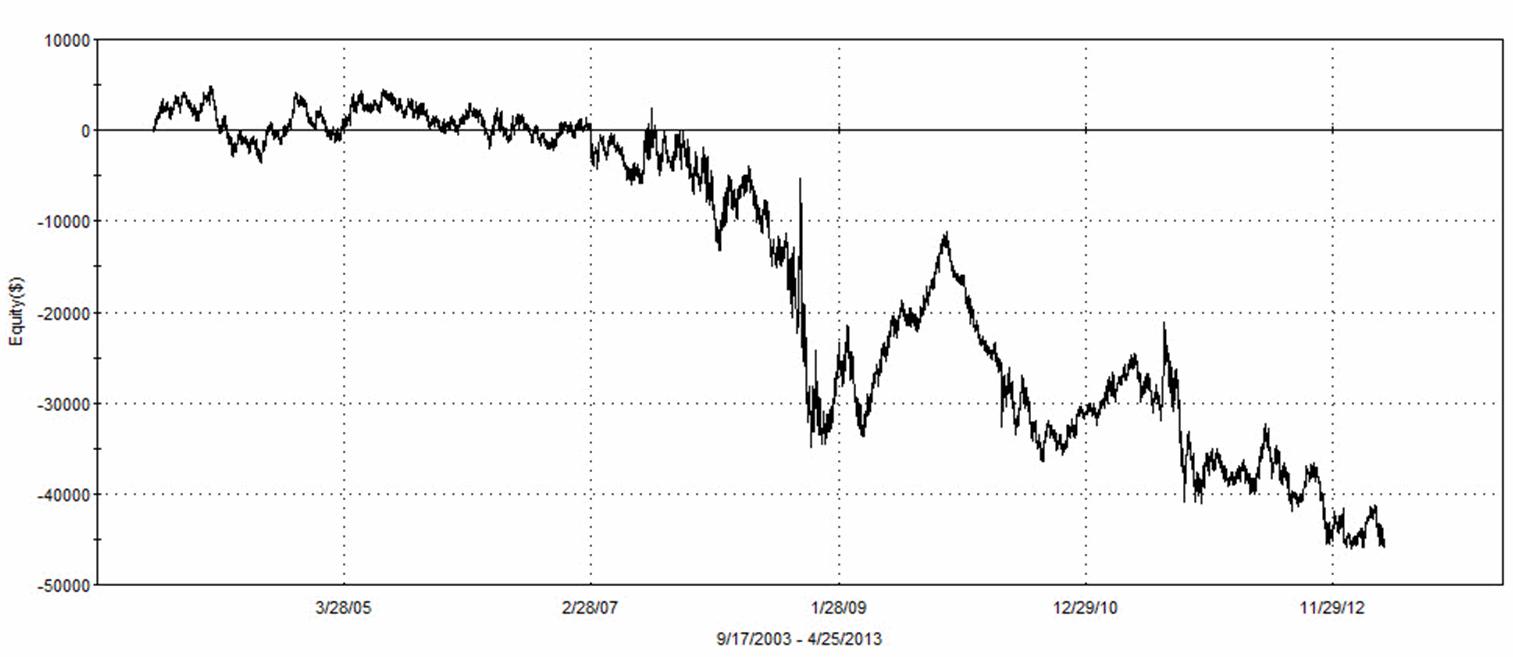
Figure 5. Trading System Using Conventional Wisdom is a Consistent Loser
A quick analysis shows us what went wrong. First, let’s assume there is a 20 bar dominant cycle in the data. This happens to be more or less true from my spectral measurements. It is also logical from a fundamental perspective because the companies that comprise the S&P Index generally have to make their numbers on a monthly basis. So, we are generally expecting a 10 bar move to the upside and a 10 bar move to the downside. Now, let’s add up the lag in our calculations. The Roofing filter and the Stochastic both have about two bars of lag. We can only make a trade entry on the bar after the signal, so there is another bar of lag. Finally, we average about three bars of lag waiting for confirmation. When we add these lags, we find they total 8 bars. We generally have 8 bars of lag in an expected 10 bar move. No wonder the trading strategy is a consistent loser!
There is a temptation to simple reverse the rules to convert the trading strategy to a winner. That’s like doing brain surgery with an axe. I avoid such tactics because sloppy rules like that generally return to bite you. There is a much more elegant solution available.
Anticipating the price turning points is done by creating rules to Buy when the MESA Stochastic crosses under 20 and to Sell Short when the MESA Stochastic crosses over 80. The rules are displayed as the green and red arrows overlaid on the MESA Stochastic indicator in Figure 6.
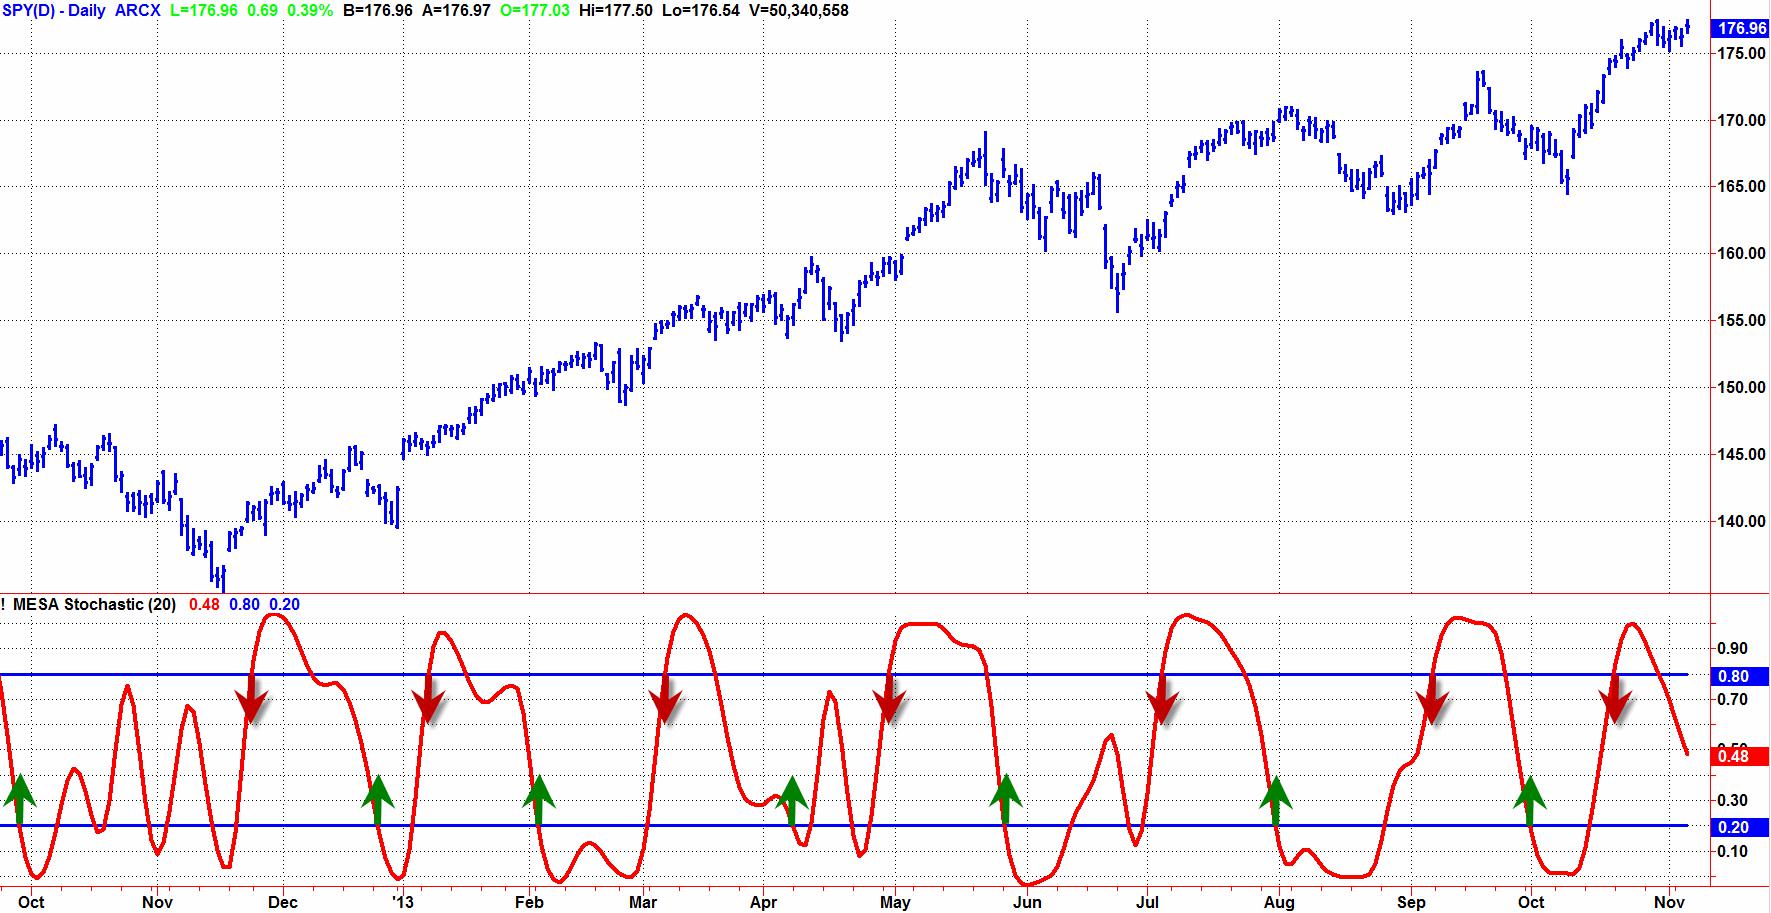
Figure 6. The PredictiveMESAStochastic Anticipates the Cyclic Turning Points
As before, I created a trading strategy using ONLY these rules and ran the strategy over 10 years of continuous ES daily data. The resulting equity growth curve is shown in Figure 7. Now we have a consistent winner! It is not too much of a job to add some ancillary rules, stops, and so forth to have a real trading system.
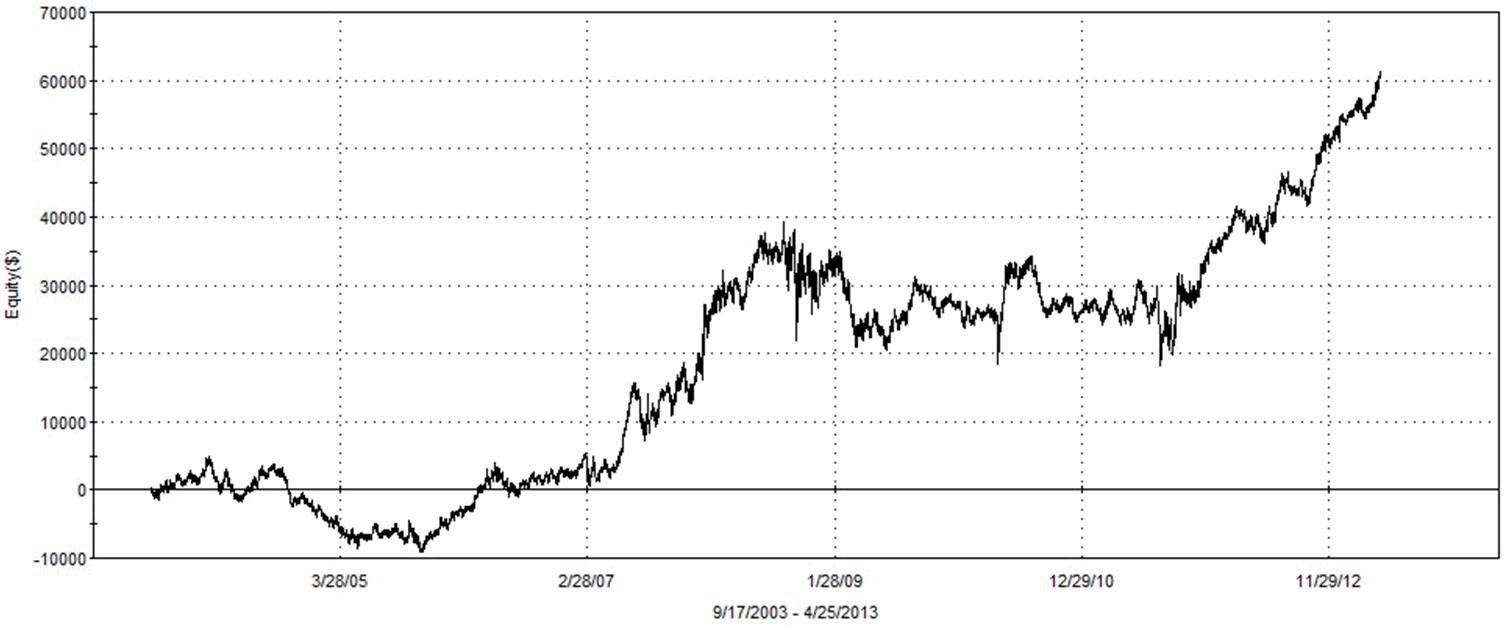
Figure 7. Equity Growth Curve Using the PredictiveMESAStochastic Rules
Nothing has changed in the indicator calculations. We still have 2 bars of lag due to the Roofing filter and the Stochastic calculation. We still have one bar of lag making the trade entry after getting the signal. The difference is that we have a minus 3 bars of lag because we are anticipating the turning point of the MESA Stochastic indicator. Therefore, we have a net 2 bar lag of our trade entry relative to the nominal extremes in the price movement. In other words, we have virtually predicted the point at which the price will reverse its swing.
The concept of anticipating the cyclic turning point is used at www.StockSpotter.com. Figure 8 shows the Swing Trade Setup Analyzer. Two indicators form the basis of the anticipating the price turning points, the Cycle indicator and the Momentum indicator. Note that both indicators have a zero mean and are also very smooth, showing that the effects of Spectral Dilation and Aliasing Noise have been removed. The Cycle Indicator peaks and troughs precede the peaks and troughs in the prices, with troughs indicated by green bars and peaks indicated by red bars. The blue line Momentum Indicator behaves analogously to the Stochastic. That is, it has some lag. A swing trade setup occurs when the Cycle indicator reaches a trough within the last few days and the Momentum Indicator is declining or at a minimum. The swing setups are shown by the yellow and green triangles on the price chart.
Figure 8 is not a cherry-picked example. You can analyze any stock for FREE at StockSpotter.com using the Swing Trade Setup Analyzer for yourself. In fact, there are several more valuable indicators there for FREE. StockSpotter.com also features scanners that identify a variety of trading situations. Premium members receive explicit buy and sell signals at the end of the trading day for exercise at the market on the open of the next trading day. All signals are given IN ADVANCE and then the hypothetical trading performance is transparently tracked and reported.
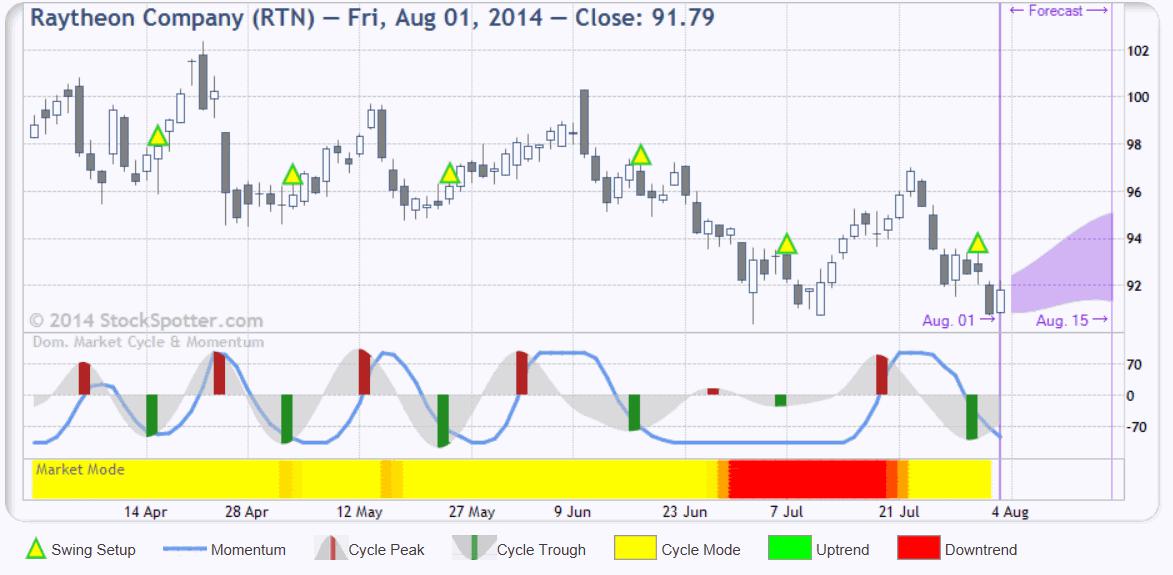
Figure 8. StockSpotter.com Anticipates Turning Points
CONCLUSIONS
There are several important concepts that have been introduced. These are the “take-aways” that you should remember for your trading.
1. Market data has Spectral Dilation. Spectral Dilation distorts the interpretation of common technical indicators.
2. Spectral Dilation must be removed using my Roofing Filter or some other filtering technique for effective swing trading.
3. Waiting for confirmation from an indicator generally does not produce a profitable swing trading strategy.
4. Anticipating price turning points is the basis of a good swing trading strategy. From a statistical point of view, anticipating a price turning point is similar to expecting a reversion to the mean. This technique is utilized in StockSpotter.com.
John Ehlers can be contacted on this link: John Ehlers
Here was my epiphany regarding market data: Like everyone, I knew the market data was fractal. However I completely disregarded this fact when looking at oscillator type indicators such as the Momentum, Stochastic, RSI, MACD, or CCI. In a nutshell, all these indicators are first order differentiators. That is, they all take just one difference in their calculation. A basic principle of filtering is that simple differencing has an attenuation rolloff of 6 dB per octave per order of the filter in the attenuation band of the filter. Therefore, all of these indicators roll off at the rate of 6 dB per octave like a simple HighPass filter. Since the data amplitude swings are increasing at the rate of 6 dB per octave, the best these indicators can do is to flatten the response of the data spectrum in the indicator output.
Figure 1 shows the practical effect of a simple HighPass filter when applied to some sample market data. Note that during the period of the long uptrend the oscillator does not have a zero mean. That is, the wiggles are not centered on zero. The interpretation is that the data has not been fully detrended and that the longer cycle period signals are “leaking through” the rejection band of the filter.

Figure 1. A Simple HighPass Filter Does Not Accommodate Spectral Dilation
The attenuation rate is increased 12 dB per octave in the attenuation band by using a second order HighPass Filter. The filter attenuation exceeds the 6 dB per octave Spectral Dilation in the data and therefore effective filtering of the longer cycle components is accomplished. Figure 2 shows the contrast between using a first order HighPass filter and second order HighPass filter. The dotted red line is the original response given in Figure 1 and the solid blue line is the second order response. Note the second order response provides a nominal zero mean for the oscillator and that much of the lag induced by the “leaking” longer cyclic components is eliminated.

Figure 2. The Second Order HighPass Filter Establishes a Zero Mean and Reduces Lag of the Oscillator
I call the combination of my SuperSmoother filter and the second order HighPass filter a “Roofing Filter” because it provides a roof over the data spectrum so the data is preprocessed for use with any indicator that may follow. The Roofing filter is not a bad indicator in its own right. In a sense, the Roofing filter is a kind of BandPass filter. The Roofing filter differs from a BandPass filter because the rejection response on the high frequency side is specifically designed to reject aliasing noise and the second order rejection response on the low frequency side is specifically designed to eliminate the effects of Spectral Dilation.
The MESA Stochastic is just a standard Stochastic calculation preceded by a Roofing filter, and is just one example of the use of the Roofing filter. The two indicators are compared in Figure 3. I rememberGeorge Lane, a bombastic speaker, list the myriad of rules in the use of the Stochastic. Some depended on %D crossing %K on the right side or left side. Also one rule was “In an uptrend, don’t go short until %D crossed below 80 three times”. As we now see, all those rules are just plain silly. The distortion of the Stochastic in an uptrend is due solely to Spectral Dilation. When the Roofing filter precedes the Stochastic, the result is an easy-to-use oscillator whose swings are nearly in synchronization with the swings in the prices.

Figure 3. Roofing Filter Removes Spectral Dilation Effects from Indicators
Figure 4 shows how the MESA Stochastic would be used with conventional wisdom. Conventional wisdom says to wait for confirmation of the turning point before making a trade entry. That translates to rules that say “Buy when MESA Stochastic crosses over 20” and “Sell Short whenMESAStochastic crosses under 80”. The green and red arrows indicate application of those rules.

Figure 4. Conventional Wisdom Says to Wait for Confirmation Before Making a Trade Entry
A casual review of those rules seem to confirm they are good rules. Not trusting anecdotal evidence, I wrote a trading strategy that contain ONLY those rules. There were no other qualifying rules and no stop exits. When I ran that trading system on 10 years of continuous ES daily data I got the Equity Growth Curve shown in Figure 5. The trading system using conventional wisdom was a consistent loser!

Figure 5. Trading System Using Conventional Wisdom is a Consistent Loser
A quick analysis shows us what went wrong. First, let’s assume there is a 20 bar dominant cycle in the data. This happens to be more or less true from my spectral measurements. It is also logical from a fundamental perspective because the companies that comprise the S&P Index generally have to make their numbers on a monthly basis. So, we are generally expecting a 10 bar move to the upside and a 10 bar move to the downside. Now, let’s add up the lag in our calculations. The Roofing filter and the Stochastic both have about two bars of lag. We can only make a trade entry on the bar after the signal, so there is another bar of lag. Finally, we average about three bars of lag waiting for confirmation. When we add these lags, we find they total 8 bars. We generally have 8 bars of lag in an expected 10 bar move. No wonder the trading strategy is a consistent loser!
There is a temptation to simple reverse the rules to convert the trading strategy to a winner. That’s like doing brain surgery with an axe. I avoid such tactics because sloppy rules like that generally return to bite you. There is a much more elegant solution available.
Anticipating the price turning points is done by creating rules to Buy when the MESA Stochastic crosses under 20 and to Sell Short when the MESA Stochastic crosses over 80. The rules are displayed as the green and red arrows overlaid on the MESA Stochastic indicator in Figure 6.

Figure 6. The PredictiveMESAStochastic Anticipates the Cyclic Turning Points
As before, I created a trading strategy using ONLY these rules and ran the strategy over 10 years of continuous ES daily data. The resulting equity growth curve is shown in Figure 7. Now we have a consistent winner! It is not too much of a job to add some ancillary rules, stops, and so forth to have a real trading system.

Figure 7. Equity Growth Curve Using the PredictiveMESAStochastic Rules
Nothing has changed in the indicator calculations. We still have 2 bars of lag due to the Roofing filter and the Stochastic calculation. We still have one bar of lag making the trade entry after getting the signal. The difference is that we have a minus 3 bars of lag because we are anticipating the turning point of the MESA Stochastic indicator. Therefore, we have a net 2 bar lag of our trade entry relative to the nominal extremes in the price movement. In other words, we have virtually predicted the point at which the price will reverse its swing.
The concept of anticipating the cyclic turning point is used at www.StockSpotter.com. Figure 8 shows the Swing Trade Setup Analyzer. Two indicators form the basis of the anticipating the price turning points, the Cycle indicator and the Momentum indicator. Note that both indicators have a zero mean and are also very smooth, showing that the effects of Spectral Dilation and Aliasing Noise have been removed. The Cycle Indicator peaks and troughs precede the peaks and troughs in the prices, with troughs indicated by green bars and peaks indicated by red bars. The blue line Momentum Indicator behaves analogously to the Stochastic. That is, it has some lag. A swing trade setup occurs when the Cycle indicator reaches a trough within the last few days and the Momentum Indicator is declining or at a minimum. The swing setups are shown by the yellow and green triangles on the price chart.
Figure 8 is not a cherry-picked example. You can analyze any stock for FREE at StockSpotter.com using the Swing Trade Setup Analyzer for yourself. In fact, there are several more valuable indicators there for FREE. StockSpotter.com also features scanners that identify a variety of trading situations. Premium members receive explicit buy and sell signals at the end of the trading day for exercise at the market on the open of the next trading day. All signals are given IN ADVANCE and then the hypothetical trading performance is transparently tracked and reported.

Figure 8. StockSpotter.com Anticipates Turning Points
CONCLUSIONS
There are several important concepts that have been introduced. These are the “take-aways” that you should remember for your trading.
1. Market data has Spectral Dilation. Spectral Dilation distorts the interpretation of common technical indicators.
2. Spectral Dilation must be removed using my Roofing Filter or some other filtering technique for effective swing trading.
3. Waiting for confirmation from an indicator generally does not produce a profitable swing trading strategy.
4. Anticipating price turning points is the basis of a good swing trading strategy. From a statistical point of view, anticipating a price turning point is similar to expecting a reversion to the mean. This technique is utilized in StockSpotter.com.
John Ehlers can be contacted on this link: John Ehlers
Last edited by a moderator:

