Predicting future FX support and resistance levels using mathematics

  • Thread starter Thread starter gka
  • Start date Start date
  • Watchers Watchers 37
GBPUSD, EURGBP, EURUSD, USDCAD & EURCAD results for 4th October 2019 - US Nonfarm payrolls

Volatility Response Model (VRM) described in the first post of this thread.

EURCAD added to complete another triplet. Now there are two triplets.

EURGBP X GBPUSD = EURUSD

EURUSD X USDCAD = EURCAD

The FX pairs follow each other about their respective VRM levels. Good for additional trading signals !

Here are the results for the GBPUSD, EURGBP, EURUSD, USDCAD & EURCAD at end of day 4th October

The daily VRM charts below now only display the highest , lowest and S1 sentiments levels. These are the most important sentiment levels.

TWO FILES ATTACHED

FIRST FILE

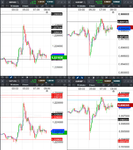
Weekly VRM levels in the top 1 hour charts. Daily VRM levels in the bottom 1 hour charts. Times are GMT-3 . EMA channel (4,7) included. All charts show the mid-price between the bid and the offer.

GBPUSD Another Brexit day. GBPUSD fell below daily S1 sentiment level 1.2347 and fell to weekly level 1.2278 before rallying.

EURGBP rose to the middle of its long term trend channel at 0.8936 and then fell back.

EURUSD moved sideways with support on the middle of its short term trend channel at 1.0963.

USDCAD fell below its daily S1 sentiment level 1.3333 down to its daily level 1.3295 then rallied.

EURCAD could not break up through its highest daily sentiment level at 1.4638 and fell to daily level 1.4577.

SECOND FILE

Shows the 3 hour candlestick charts with EMA channel (4.7) throughout the week with weekly VRM levels for the 5 FX pairs. All charts show the mid-price between the bid and the offer.

GBPUSD cascaded down and then up its weekly levels 1.2278, 1.2247 and 1.2205. Before finally breaking up through its weekly S1 sentiment level 1.2322.

EURGBP found support on its weekly S1 sentiment level 0.8854 and tried twice to break up through the middle of its long term trend channel at 0.8936 and failed

EURUSD found support at weekly level 1.0883 and rallied to its highest weekly sentiment level 1.0986.

USDCAD tried once to break up through the middle of its long term trend channel at 1.3290 and failed. On the second attempt it broke through and rallied to weekly sentiment level 1.3338.

EURCAD found support at its weekly sentiment level 1.4409 and rallied to weekly level 1.4664.

2019-10-04-GBPUSD-EURGBP-EURUSD-USDCAD-EURCAD-1hr-1hr.png

2019-10-04-GBPUSD-EURGBP-EURUSD-USDCAD-EURCAD-3hr.png
 
GBPUSD, EURGBP, EURUSD, USDCAD & EURCAD results for 7th October 2019

Volatility Response Model (VRM) described in the first post of this thread.

EURCAD added to complete another triplet. Now there are two triplets.

EURGBP X GBPUSD = EURUSD

EURUSD X USDCAD = EURCAD

The FX pairs follow each other about their respective VRM levels. Good for additional trading signals !

Here are the results for the GBPUSD, EURGBP, EURUSD, USDCAD & EURCAD at end of day 7th October

The daily VRM charts below now only display the highest , lowest and S1 sentiments levels. These are the most important sentiment levels.

ONE FILE ATTACHED

Weekly VRM levels in the top 30 minute charts. Daily VRM levels in the bottom 30 minute charts. Times are GMT-3 . EMA channel (4,7) included. All charts show the mid-price between the bid and the offer.

FX pairs following other FX pairs today.

GBPUSD at Sunday start-up followed EURGBP . EURGBP rallied from its daily S1 sentiment level and GBPUSD fell to its daily level 1.2285. GBPUSD then rallied to its high following EURUSD to its daily high.

EURGBP had support all day on its daily S1 sentiment level 0.8904

EURUSD had initial resistance at its daily S1 sentiment level 1.0989 and made its low when GBPUSD made its low. Then rallied to its weekly sentiment level 1.0995 before falling back

USDCAD had support at the middle of its long term trend channel 1.3304. Then resistance at its weekly sentiment level 1.3330. Then fell back to its low as EURUSD made its high for the day.

EURCAD was trapped between its weekly sentiment levels 1.4638 and 1.4600

2019-10-07-GBPUSD-EURGBP-EURUSD-USDCAD-EURCAD-30min-30min.png
 
GBPUSD, EURGBP, EURUSD, USDCAD & EURCAD results for 8th October 2019

Volatility Response Model (VRM) described in the first post of this thread.

EURCAD added to complete another triplet. Now there are two triplets.

EURGBP X GBPUSD = EURUSD

EURUSD X USDCAD = EURCAD

The FX pairs follow each other about their respective VRM levels. Good for additional trading signals !

Here are the results for the GBPUSD, EURGBP, EURUSD, USDCAD & EURCAD at end of day 8th October

The daily VRM charts below now only display the highest , lowest and S1 sentiments levels. These are the most important sentiment levels.

THREE FILES ATTACHED

FIRST FILE


Weekly VRM levels in the top 30 minute charts. Daily VRM levels in the bottom 30 minute charts. Times are GMT-3 . EMA channel (4,7) included. All charts show the mid-price between the bid and the offer.

GBPUSD found resistance at weekly level 1.2300 and fell to daily level 1.2202

EURGBP was bullish above its daily S1 sentiment level 0.8920 and rose to daily level 0.8998

EURUSD made its high at weekly sentiment level 1.0995 and fell to its daily level 1.0950

USDCAD rose from the middle of its short term trend channel at 1.3285 and made its high about weekly sentiment level 1.3330

EURCAD followed USDCAD at the start of the day and made its high at weekly sentiment level 1.4638 then fell to daily sentiment level 1.4596

REMAINING 2 FILES

Two files spanning the day. Weekly VRM levels in the top 15 minute charts. Daily VRM levels in the bottom 15 minute charts. Times are GMT-3 . EMA channel (4,7) included. All charts show the mid-price between the bid and the offer.

Show the interaction of the FX pairs with their respective VRM levels in more detail.

2019-10-08-GBPUSD-EURGBP-EURUSD-USDCAD-EURCAD-30min-30min.png

2019-10-08-1135-GBPUSD-EURGBP-EURUSD-USDCAD-EURCAD-15min-15min.png

2019-10-08-1800-GBPUSD-EURGBP-EURUSD-USDCAD-EURCAD-15min-15min.png
 
GBPUSD, EURGBP, EURUSD, USDCAD & EURCAD results for 9th October 2019

Volatility Response Model (VRM) described in the first post of this thread.

EURCAD added to complete another triplet. Now there are two triplets.

EURGBP X GBPUSD = EURUSD

EURUSD X USDCAD = EURCAD

The FX pairs follow each other about their respective VRM levels. Good for additional trading signals !

Here are the results for the GBPUSD, EURGBP, EURUSD, USDCAD & EURCAD at end of day 9th October

The daily VRM charts below now only display the highest , lowest and S1 sentiments levels. These are the most important sentiment levels.

TWO FILES ATTACHED

FIRST FILE


Weekly VRM levels in the top 30 minute charts. Daily VRM levels in the bottom 30 minute charts. Times are GMT-3 . EMA channel (4,7) included. All charts show the mid-price between the bid and the offer.

GBPUSD low at daily level 1.2205. High at daily sentiment level 1.2291

EURGBP low at daily level 0.8937. High at top of short term trend channel 0.8991

EURUSD looked on and passed up through the middle of its short term trend channel at 1.0969

USDCAD low at the middle of its long term trend channel 1.3304. Broke through its weekly sentiment level 1.3330

EURCAD rose through its weekly sentiment level 1.4600. And ended up trapped between its weekly sentiment levels 1.4624 and 1.4638.

SECOND FILE

Shows GBPUSD and EURGBP price action about the 05:00 (GMT-3) volatility. Weekly VRM levels in the top 10 minute charts. Daily VRM levels in the bottom 10 minute charts. Times are GMT-3 . EMA channel (4,7) included. All charts show the mid-price between the bid and the offer.

Show the volatility of GBPUSD and EURGBP today about the VRM levels. Another good example showing a volatile market moving rapidly about the VRM levels.

2019-10-09-GBPUSD-EURGBP-EURUSD-USDCAD-EURCAD-30min-30min.png

2019-10-09-0936-GBPUSD-EURGBP-10min-10min.png
 
GBPUSD, EURGBP, EURUSD, USDCAD & EURCAD results for 10th October 2019

Volatility Response Model (VRM) described in the first post of this thread.

EURCAD added to complete another triplet. Now there are two triplets.

EURGBP X GBPUSD = EURUSD

EURUSD X USDCAD = EURCAD

The FX pairs follow each other about their respective VRM levels. Good for additional trading signals !

Here are the results for the GBPUSD, EURGBP, EURUSD, USDCAD & EURCAD at end of day 10th October

The daily VRM charts below now only display the highest , lowest and S1 sentiments levels. These are the most important sentiment levels.

TWO FILES ATTACHED

FIRST FILE


Weekly VRM levels in the top 1 hour charts. Daily VRM levels in the bottom 1 hour charts. Times are GMT-3 . EMA channel (4,7) included. All charts show the mid-price between the bid and the offer.

Another Brexit news day

GBPUSD Found support on weekly level 1.2215 and high at weekly level 1.2454. Just below the middle of its long term trend channel at 1.2462

EURGBP found resistance at daily level 0.9013 and fell to daily level 0.8839

EURUSD followed GBPUSD then EURGBP

USDCAD high at weekly sentiment level 1.3346 then fell to daily level 1.3272

EURCAD high at daily level 1.4689 and low at weekly S1 sentiment level 1.4624

SECOND FILE

Weekly VRM levels in the top 30 minute charts. Daily VRM levels in the bottom 30 minute charts. Times are GMT-3 . EMA channel (4,7) included. All charts show the mid-price between the bid and the offer.

Show the volatility of GBPUSD and EURGBP today about the VRM levels. Another good example showing a volatile market moving about the VRM levels.

2019-10-10-GBPUSD-EURGBP-EURUSD-USDCAD-EURCAD-1hr-1hr.png

2019-10-10-GBPUSD-EURGBP-EURUSD-USDCAD-EURCAD-30min-30min.png
 
GBPUSD, EURGBP, EURUSD, USDCAD & EURCAD results for 11th October 2019

Volatility Response Model (VRM) described in the first post of this thread.

EURCAD added to complete another triplet. Now there are two triplets.

EURGBP X GBPUSD = EURUSD

EURUSD X USDCAD = EURCAD

The FX pairs follow each other about their respective VRM levels. Good for additional trading signals !

Here are the results for the GBPUSD, EURGBP, EURUSD, USDCAD & EURCAD at end of day 11th October

The daily VRM charts below now only display the highest , lowest and S1 sentiments levels. These are the most important sentiment levels.

TWO FILES ATTACHED

FIRST FILE

Weekly VRM levels in the top 1 hour charts. Daily VRM levels in the bottom 1 hour charts. Times are GMT-3 . EMA channel (4,7) included. All charts show the mid-price between the bid and the offer.

GBPUSD finally broke up through the top of its short term trend channel at 1.2547 and made its high at daily level 1.2683

EURGBP after some support at weekly sentiment level 0.8832 then fell to weekly level 0.8695

EURUSD had support on weekly S1 sentiment level 1.1006 / daily sentiment level 1.1006 then broke through the middle of its long term trend channel at 1.1022

USDCAD had some support at daily S1 sentiment level 1.3288 then fell to the bottom of its short term trend channel at 1.3169

EURCAD high at daily level 1.4689 and low at daily level 1.4546

SECOND FILE

Shows the 3 hour candlestick charts with EMA channel (4.7) throughout the week with weekly VRM levels for the 5 FX pairs. All charts show the mid-price between the bid and the offer.

GBPUSD spent about 2 days with support on weekly level 1.2215 then rallied to the middle of its long term trend channel 1.2462. Spent 12 hours breaking through 1.2462. Then rallied today to 1.2668

EURGBP fell to its lowest weekly sentiment level 0.8832 as GBPUSD rallied. Spent at least 12 hours at this level. Then fell further to weekly level 0.8715

EURUSD followed GBPUSD and EURGBP during the week

USDCAD fell from its high at weekly sentiment level 1.3346 to its low at weekly level 1.3189

EURCAD started with support on its lowest weekly sentiment level 1.4600. Then fell from its high at the middle of its long term trend channel at 1.4676

2019-10-11-GBPUSD-EURGBP-EURUSD-USDCAD-EURCAD-1hr-1hr.png

2019-10-11-GBPUSD-EURGBP-EURUSD-USDCAD-EURCAD-3hr.png
 
GBPUSD, EURGBP, EURUSD, USDCAD & EURCAD results for 14th October 2019

Volatility Response Model (VRM) described in the first post of this thread.

EURCAD added to complete another triplet. Now there are two triplets.

EURGBP X GBPUSD = EURUSD

EURUSD X USDCAD = EURCAD

The FX pairs follow each other about their respective VRM levels. Good for additional trading signals !

Here are the results for the GBPUSD, EURGBP, EURUSD, USDCAD & EURCAD at end of day 14th October

The daily VRM charts below now only display the highest , lowest and S1 sentiments levels. These are the most important sentiment levels.

ONE FILE ATTACHED

FIRST FILE


Weekly VRM levels in the top 30 minute charts. Daily VRM levels in the bottom 30 minute charts. Times are GMT-3 . EMA channel (4,7) included. All charts show the mid-price between the bid and the offer.

Another Brexit day

GBPUSD resistance at daily level 1.2639 and support at weekly level 1.2534

EURGBP support at daily level 0.8721 and resistance at daily level 0.8815

EURUSD support at the middle of its long term trend channel at 1.1018 and resistance at its daily level 1.1040

USDCAD support at daily sentiment level 1.3205

EURCAD support at daily sentiment level 1.4558 and resistance at weekly sentiment level 1.4598

2019-10-14-GBPUSD-EURGBP-EURUSD-USDCAD-EURCAD-30min-30min.png
 
GBPUSD, EURGBP, EURUSD, USDCAD & EURCAD results for 15th October 2019

Volatility Response Model (VRM) described in the first post of this thread.

EURCAD added to complete another triplet. Now there are two triplets.

EURGBP X GBPUSD = EURUSD

EURUSD X USDCAD = EURCAD

The FX pairs follow each other about their respective VRM levels. Good for additional trading signals !

Here are the results for the GBPUSD, EURGBP, EURUSD, USDCAD & EURCAD at end of day 15th October

The daily VRM charts below now only display the highest , lowest and S1 sentiments levels. These are the most important sentiment levels.

ONE FILE ATTACHED

FIRST FILE


Weekly VRM levels in the top 1 hour charts. Daily VRM levels in the bottom 1 hour charts. Times are GMT-3 . EMA channel (4,7) included. All charts show the mid-price between the bid and the offer.

Another Brexit day

GBPUSD supported at the top of its short term trend channel at 1.2620 and rallied to daily level 1.2786

EURGBP fell below the bottom of its short term trend channel at 0.8747 and then fell for the rest of the day

EURUSD found resistance at daily S1 sentiment level 1.1037 / weekly sentiment level 1.1037 and followed GBPUSD on the 11:00 (GMT-3) rally

USDCAD unable to break up through its highest daily sentiment level 1.,3236 and fell to weekly S1 sentiment level 1.3199

EURCAD could not break up through weekly sentiment level 1.4598 and fell to daily level 1.4554

2019-10-15-GBPUSD-EURGBP-EURUSD-USDCAD-EURCAD-1hr-1hr.png
 
GBPUSD, EURGBP, EURUSD, USDCAD & EURCAD results for 16th October 2019

Volatility Response Model (VRM) described in the first post of this thread.

EURCAD added to complete another triplet. Now there are two triplets.

EURGBP X GBPUSD = EURUSD

EURUSD X USDCAD = EURCAD

The FX pairs follow each other about their respective VRM levels. Good for additional trading signals !

Here are the results for the GBPUSD, EURGBP, EURUSD, USDCAD & EURCAD at end of day 16th October

The daily VRM charts below now only display the highest , lowest and S1 sentiments levels. These are the most important sentiment levels.

ONE FILE ATTACHED

FIRST FILE


Weekly VRM levels in the top 1 hour charts. Daily VRM levels in the bottom 1 hour charts. Times are GMT-3 . EMA channel (4,7) included. All charts show the mid-price between the bid and the offer.

GBPUSD support on the top of the short term trend channel at 1.2675 and resistance at the top of the long term trend channel at 1.2859

EURGBP resistance at the bottom of the short term trend channel at 0.8721 and support at daily level 0.8596

EURUSD support on the middle of the short term trend channel at 1.1019

USDCAD resistance at the weekly sentiment level 1.3228 and support at the lowest daily sentiment level 1.3181

EURCAD support at the weekly S1 sentiment level 1.4564 and resistance at daily level 1.4627

2019-10-16-GBPUSD-EURGBP-EURUSD-USDCAD-EURCAD-1hr-1hr.png
 
GBPUSD, EURGBP, EURUSD, USDCAD & EURCAD results for 17th October 2019

Volatility Response Model (VRM) described in the first post of this thread.

EURCAD added to complete another triplet. Now there are two triplets.

EURGBP X GBPUSD = EURUSD

EURUSD X USDCAD = EURCAD

The FX pairs follow each other about their respective VRM levels. Good for additional trading signals !

Here are the results for the GBPUSD, EURGBP, EURUSD, USDCAD & EURCAD at end of day 17th October

The daily VRM charts below now only display the highest , lowest and S1 sentiments levels. These are the most important sentiment levels.

ONE FILE ATTACHED

FIRST FILE


Weekly VRM levels in the top 1 hour charts. Daily VRM levels in the bottom 1 hour charts. Times are GMT-3 . EMA channel (4,7) included. All charts show the mid-price between the bid and the offer.

GBPUSD low at daily level 1.2740 and high at daily level 1.2987

EURGBP low at daily level 0.8579 and high at the bottom of its short term trend channel 0.8695

EURUSD low at its lowest daily sentiment level 1.1066 and high at weekly level 1.1143

USDCAD high at its highest daily sentiment level 1.3215 and low at its daily level 1.3132

EURCAD trapped between the middle of its long term trend channel 1.4659 and its highest weekly sentiment level 1.4598

2019-10-17-GBPUSD-EURGBP-EURUSD-USDCAD-EURCAD-1hr-1hr.png
 
GBPUSD, EURGBP, EURUSD, USDCAD & EURCAD results for 18th October 2019

Volatility Response Model (VRM) described in the first post of this thread.

EURCAD added to complete another triplet. Now there are two triplets.

EURGBP X GBPUSD = EURUSD

EURUSD X USDCAD = EURCAD

The FX pairs follow each other about their respective VRM levels. Good for additional trading signals !

Here are the results for the GBPUSD, EURGBP, EURUSD, USDCAD & EURCAD at end of day 18th October

The daily VRM charts below now only display the highest , lowest and S1 sentiments levels. These are the most important sentiment levels.

TWO FILES ATTACHED

FIRST FILE

Weekly VRM levels in the top 1 hour charts. Daily VRM levels in the bottom 1 hour charts. Times are GMT-3 . EMA channel (4,7) included. All charts show the mid-price between the bid and the offer.

GBPUSD made its low as EURGBP made its high. Rallied from 03:00 (GMT-3) through daily and weekly VRM levels

EURGBP made its high at daily sentiment level 0.8663 and fell to its low at daily level 0.8605

EURUSD found support at daily sentiment level 1.1114 and rallied through daily and weekly VRM levels

USDCAD high at daily sentiment level 1.3146 and low at weekly level 1.3123 / daily sentiment level 1.3124

EURCAD low at daily sentiment level 1.4609 and rallied through daily and weekly levels

SECOND FILE

Shows the 3 hour candlestick charts with EMA channel (4.7) throughout the week with weekly VRM levels for the 5 FX pairs. All charts show the mid-price between the bid and the offer.

GBPUSD support at weekly level 1.2534 and rallied up above the top of its long term trend channel at 1.2859

EURGBP failed to break up through its weekly S1 sentiment level 0.8767 and fell to weekly level 0.8609

EURUSD failed to break down through the middle of its long term trend channel at 1.1018 and rallied up through weekly levels

USDCAD Unable to break up through weekly sentiment level 1.3228 and fell to weekly level 1.3123

EURCAD unable to break down through weekly S1 sentiment level 1.4564 and rallied to the middle of its long term trend channel at 1.4659

2019-10-18-GBPUSD-EURGBP-EURUSD-USDCAD-EURCAD-1hr-1hr.png

2019-10-18-GBPUSD-EURGBP-EURUSD-USDCAD-EURCAD-3hr.png
 
GBPUSD, EURGBP, EURUSD, USDCAD & EURCAD results for 21st October 2019

Volatility Response Model (VRM) described in the first post of this thread.

EURCAD added to complete another triplet. Now there are two triplets.

EURGBP X GBPUSD = EURUSD

EURUSD X USDCAD = EURCAD

The FX pairs follow each other about their respective VRM levels. Good for additional trading signals !

Here are the results for the GBPUSD, EURGBP, EURUSD, USDCAD & EURCAD at end of day 21st October

The daily VRM charts below now only display the highest , lowest and S1 sentiments levels. These are the most important sentiment levels.

ONE FILE ATTACHED

FIRST FILE


Weekly VRM levels in the top 30 minute charts. Daily VRM levels in the bottom 30 minute charts. Times are GMT-3 . EMA channel (4,7) included. All charts show the mid-price between the bid and the offer.

GBPUSD support at the top of its short term trend channel at 1.2894. Resistance at daily level 1.3002

EURGBP resistance at daily sentiment level 0.8655. Support at daily level 0.8578

EURUSD looked on with resistance at weekly S1 sentiment level 1.1175

USDCAD fell to daily level 1.3084

EURCAD fell to daily level 1.4583

2019-10-21-GBPUSD-EURGBP-EURUSD-USDCAD-EURCAD-30min-30min.png
 
Hey gka

So are you trading the bounces back into these zones ?
N
 
Hey gka

So are you trading the bounces back into these zones ?
N
On the short timescale (hours) I look for large gaps and trade between VRM levels. I use 3 FX pairs in a triplet to confirm trades. Can't have EURUSD as a a buy when GBPUSD and EURGBP are a sell.

On the long term when the short term trend channel has bounced off the long term trend channel then I take positions that can last many days.


ok thanks.......I had a trading mate that used to use that Triage method ......a very basic style of strengthmeter trading !
 
ok thanks.......I had a trading mate that used to use that Triage method ......a very basic style of strengthmeter trading !
some confusion here. I am not using arbitrage .I analyse 3 fx pairs in a triplet using the VRM. Then i make sure the VRM results are consistent for the triplet. You can do the same with your correlation trading strategy.
 
GBPUSD, EURGBP, EURUSD, USDCAD & EURCAD results for 22nd October 2019

Volatility Response Model (VRM) described in the first post of this thread.

EURCAD added to complete another triplet. Now there are two triplets.

EURGBP X GBPUSD = EURUSD

EURUSD X USDCAD = EURCAD

The FX pairs follow each other about their respective VRM levels. Good for additional trading signals !

Here are the results for the GBPUSD, EURGBP, EURUSD, USDCAD & EURCAD at end of day 22nd October

The daily VRM charts below now only display the highest , lowest and S1 sentiments levels. These are the most important sentiment levels.

ONE FILE ATTACHED

FIRST FILE


Weekly VRM levels in the top 1 hour charts. Daily VRM levels in the bottom 1 hour charts. Times are GMT-3 . EMA channel (4,7) included. All charts show the mid-price between the bid and the offer. Timescale is 2 days . Weekly levels valid over the last 2 days. Daily levels valid only over the last 24 hours.

GBPUSD unable to break up through the top of the short term trend channel at 1.2980 and GBPUSD falling

EURGBP found support at the bottom of its short term trend channel at 0.8593

EURUSD fell to its daily level 1.1123

USDCAD found support on its lowest daily sentiment level 1.3080 and rallied

EURCAD fell to its lowest daily sentiment level 1.4573

2019-10-22-GBPUSD-EURGBP-EURUSD-USDCAD-EURCAD-1hr-1hr.png
 
GBPUSD, EURGBP, EURUSD, USDCAD & EURCAD results for 23rd October 2019

Volatility Response Model (VRM) described in the first post of this thread.

EURCAD added to complete another triplet. Now there are two triplets.

EURGBP X GBPUSD = EURUSD

EURUSD X USDCAD = EURCAD

The FX pairs follow each other about their respective VRM levels. Good for additional trading signals !

Here are the results for the GBPUSD, EURGBP, EURUSD, USDCAD & EURCAD at end of day 23rd October

The daily VRM charts below now only display the highest , lowest and S1 sentiments levels. These are the most important sentiment levels.

ONE FILE ATTACHED

FIRST FILE


Weekly VRM levels in the top 1 hour charts. Daily VRM levels in the bottom 1 hour charts. Times are GMT-3 . EMA channel (4,7) included. All charts show the mid-price between the bid and the offer .

GBPUSD followed EURGBP today. Made its low when EURGBP made its high. Then finally rose to its weekly S1 sentiment level at 1.2917

EURGBP made its high at weekly sentiment level 0.8659 then fell to weekly sentiment level 0.8618

EURUSD fell to the middle of its short term trend channel at 1.1111 then rallied

USDCAD unable to break through its highest daily sentiment level 1.3113 and fell to weekly level 1.3065

EURCAD fell to its lowest daily sentiment level at 1.4544

2019-10-23-GBPUSD-EURGBP-EURUSD-USDCAD-EURCAD-1hr-1hr.png
 
GBPUSD, EURGBP, EURUSD, USDCAD & EURCAD results for 24th October 2019

Volatility Response Model (VRM) described in the first post of this thread.

EURCAD added to complete another triplet. Now there are two triplets.

EURGBP X GBPUSD = EURUSD

EURUSD X USDCAD = EURCAD

The FX pairs follow each other about their respective VRM levels. Good for additional trading signals !

Here are the results for the GBPUSD, EURGBP, EURUSD, USDCAD & EURCAD at end of day 24th October

The daily VRM charts below now only display the highest , lowest and S1 sentiments levels. These are the most important sentiment levels.

ONE FILE ATTACHED

FIRST FILE


Weekly VRM levels in the top 30 minute charts. Daily VRM levels in the bottom 30 minute charts. Times are GMT-3 . EMA channel (4,7) included. All charts show the mid-price between the bid and the offer .

GBPUSD high at daily level 1.2955. Low at the middle of its short term trend channel at 1.2795

EURGBP high at the middle of its short term trend channel at 0.8672. Low when GBPUSD made its high

EURUSD high at daily level 1.1167. Low at daily level 1.1100

USDCAD high at the bottom of its long term trend channel at 1.3089. Supported at its daily S1 sentiment level 1.3070. Low achieved when EURUSD rallied.

EURCAD high at the middle of its short term trend channel 1.4592. Low at its daily level 1.4515

2019-10-24-GBPUSD-EURGBP-EURUSD-USDCAD-EURCAD-30min-30min.png
 
Back
Top