EURUSD results 3rd January 2019
Here are the results for EURUSD using the VRM levels for 24 hours ending 5 pm 3rd January New York time.
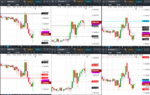
Weekly VRM levels in the top 1 hour chart over 2 days, daily VRM levels in the bottom 1 hour chart. Times are GMT-4 . EMA channel (4,7) included.
Key events during the 24 hours.
Large volatility in the 18:00 hour 2 Jan. (GMT-4) which took the EURUSD down to its low at weekly level 1.1311, daily level 1.1310. These daily and weekly levels agree within 1 basis point using completely different data sets to calculate them.
Rally at 20:00 (GMT-4) up to the middle of the long term trend channel at 1.1376 (blue line).
Then back down to the daily sentiment level at 1.1338 before a final rally to the high of the day at daily level 1.1411.
Lots of gaps to trade between

Here are the results for EURUSD using the VRM levels for 24 hours ending 5 pm 3rd January New York time.
Weekly VRM levels in the top 1 hour chart over 2 days, daily VRM levels in the bottom 1 hour chart. Times are GMT-4 . EMA channel (4,7) included.
Key events during the 24 hours.
Large volatility in the 18:00 hour 2 Jan. (GMT-4) which took the EURUSD down to its low at weekly level 1.1311, daily level 1.1310. These daily and weekly levels agree within 1 basis point using completely different data sets to calculate them.
Rally at 20:00 (GMT-4) up to the middle of the long term trend channel at 1.1376 (blue line).
Then back down to the daily sentiment level at 1.1338 before a final rally to the high of the day at daily level 1.1411.
Lots of gaps to trade between