Predicting future FX support and resistance levels using mathematics

Hi Everyone, My name is Graham and I am a mathematician here in Canada.

There are lots of different technical analysis methods to determine future support and resistance levels. They can be subjective and depend upon experience. I have been wondering whether support and resistance levels can be determined mathematically and now have a working algorithm I call the Volatility Response Model (VRM).

The VRM calculates future support and resistance levels either one day ahead or one week ahead, together with short and long term trend channels. These predictions are not extrapolations from the past. I attach a white paper describing the algorithm.

I am looking for FX traders for feedback, discussions and opinions on the VRM predictions. To this end I will post predictions in this thread as markets progress.

Here is the first set of predictions for GBPUSD in chart format starting 5 pm New York time tonight. The second attached paper describes the format of these predictions on the chart. They are essentially 24 weekly levels and 24 daily levels. The latter will last until 5 pm New York time tomorrow night. Tomorrow night after the close in New York I will post the GBPUSD market price action and the VRM levels on the same chart.

It wont work.

For any level in the market to be of significance, it needs to be known by many people - otherwise the market will not react there.

The levels that are known by the most people are the ones that are the most visually obvious.

Then there's levels driven by 'lines in the sand' drawn by governments, banks that have written barrier options etc.

So expecting math to come up with magic levels that only your formula knows about - is not realistic. Having 24 levels per day will give you enough for "confirmation bias" purposes that the market will move close to one of them anyway.

There is also the fact you are basing your research on the premise that markets can be predicted. I would first test that assumption before trying to find ways to make the prediction.
 
I have spent a lot of time experimenting with the Volatility Response Model (VRM) using different timescales and EMA channels. At short timescales like 1 minute candlesticks there are more reversals that turn out to be retracements at larger timescales. At long timescales like 4 hours the news can have a big impact while you wait for the time period to end. The mid value (between bid and ask) 30 minute candlestick charts with a EMA (4,7) channel seem the best for me. I have not been using this timescale and EMA channel for long so do not have reliable statistics. I have had a run of 11 successful trades in a row. I am very interested in traders' experiences using the VRM predicted support and resistance levels and how they use the levels.

AKA Curve Fitting....
 
GBPUSD results for today 29th Dec

Last night I attached the predicted support and resistance levels of GBPUSD of the Volatility Response Model (VRM) for today. Here are the results. Weekly levels in the top 30 minute chart, daily levels in the bottom 30 minute chart. Times are GMT-4 . EMA channel (4,7) included.

Daily level 1.3433 was the day's low before rising to daily level 1.3529. The market could not pull the EMA channel through this level.

There were retracements off daily and weekly levels back to the EMA channel.

There were some large gaps between levels.

I will refer to this chart and EURGBP and EURUSD charts shortly
 

Attachments

  • 2017-12-29-GBPUSD.png
    2017-12-29-GBPUSD.png
    105.8 KB · Views: 406
In an earlier post I asked about your trade results to-date for obvious resasons because you understand the model more than anyone else. If you can't generate a positive expetancy over many runs then it is unlikley anyone else could.

Intuitively there are too many levels to trade from. I would be interested in your trade process to make it work. The problem is that a 24 hour window in FX is actually comprised of three sessions : Asia; European; and US. The volatility and price movements of each of the currency pairs are different during each of the sessions. I am unclear on how do you filter and then integrate that difference into your trade plan for each of the currency pair.

=====================================================================
Thank you for your comments.

Your point that there are too many levels. I have seen trader's charts in other threads with even more levels. I have browsed through John Murphy's book on technical analysis so I know there are many ways to draw lines at different timescales carrying out many different types of analysis...Gann, Fibonacci, Wedge, Triangles.....and on. It's quite easy to generate hundreds of lines.

The VRM has a maximum 24 weekly levels and 24 daily levels. Weekly and daily levels are often duplicated exactly or within a couple of pips. Together with the suggestion that you only need 5 VRM levels above and below the price action means there are far fewer lines to deal with. Except when the market is extremely volatile (for instance a interest rate change) then you will not need all the levels. Tonight's VRM chart for GBPUSD needed 7 weekly levels and 8 daily levels.

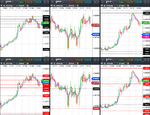
I have attached the VRM weekly (top) and daily (bottom) charts for today showing you the 30 minute candlesticks and EMA channel for GBPUSD, EURGBP and EURUSD. These levels were on the website link found at the end of my descriptive documents that started this thread. These charts cover the full 24 hours you describe for markets in Asia, Europe and US. As you can see the EURUSD market moved from weekly level 1.1942 through to weekly level 1.2025 predicted by the VRM last weekend. A large gap good for trading. You will notice that at 13:00 (GMT-4) EURUSD reached 1.2025 at the same time that GBPUSD reached its highest closing 30 minute candlestick. This tells me that GBPUSD was following EURUSD at that time.

In between the USD sell off the EURGBP did not know what to do and never smoothly bounced off a VRM level. EURGBP was never an easy trade today because it was USD sell off day.

When it's a GBP sell off day then GBPUSD and EURGBP will follow each other and EURUSD will be all over the place and never bounce smoothly off VRM levels.

Because of arbitrage GBPUSD X EURGBP = EURUSD it is necessary to consider all three FX pairs at the same time and thus all three sets of VRM levels.

So the trading strategy from 5pm last night to end of today. GBPUSD and EURUSD bounce smoothly off VRM levels from the get go. EURGBP is nowhere near a VRM level at 5pm New York last night. So it's a sell USD day. How far will these markets rise? I conservatively set the T/P at 50 points. If I were not asleep at 5 am my time in the morning then I would go for even more points by following the EMA (7.4) channel and waiting for it to crossover as it bounces off a VRM level.

I have spent a lot of time looking at different timescales and I want to reduce stress from fear and greed and exhaustion. So 30 minute candlesticks do the trick for me. From your comments I understand you have far more trading experience than I.

As a matter of interest did you have 1.2025 as today's EURUSD high? EURGBP and EURUSD predictions for this week and today will be on the website link at the end of my descriptive documents until noon on Sunday.
 

Attachments

  • 2017-12-29-GBPUSD-EURGBP-EURUSD.png
    2017-12-29-GBPUSD-EURGBP-EURUSD.png
    303.5 KB · Views: 365
It wont work.

For any level in the market to be of significance, it needs to be known by many people - otherwise the market will not react there.

The levels that are known by the most people are the ones that are the most visually obvious.

Then there's levels driven by 'lines in the sand' drawn by governments, banks that have written barrier options etc.

So expecting math to come up with magic levels that only your formula knows about - is not realistic. Having 24 levels per day will give you enough for "confirmation bias" purposes that the market will move close to one of them anyway.

There is also the fact you are basing your research on the premise that markets can be predicted. I would first test that assumption before trying to find ways to make the prediction.

Thank you for your observations. Can markets be predicted? Why are there so many different approaches? Everybody is trying to find the solution! My approach is the same approach to describe the murmurations of starlings. If you look at just one starling in a flock then it's flight path is all over the place. Looks completely random. Yet together all the thousands of starlings make a cloud with an undulating surface. Does each starling know what every other starling knows?. Together do all the FX traders have some common quality. Banks such as the BoE can draw lines and Soros can break them.

I can only test my assumptions by doing the maths and by making the predictions and seeing what happens each day.

As I wrote in my last comment. Not all the 24 levels are needed because some are duplicates and some are just 2 pips close so can be discarded. Tonight the VRM GBPUSD chart at the end of the day needed 7 weekly levels and 8 daily levels.
 
Last edited:
AKA Curve Fitting....

I can assure you the VRM is not curve fitting. Nothing is extrapolated from the past. The VRM calculates a Hamiltonian for the market then uses this to specify levels in the next time interval. The Hamiltonian is unique and written in stone for the market. It is derived from all the historical data available.
 
Thank you for your observations. Can markets be predicted? Why are there so many different approaches? Everybody is trying to find the solution! My approach is the same approach to describe the murmurations of starlings. If you look at just one starling in a flock then it's flight path is all over the place. Looks completely random. Yet together all the thousands of starlings make a cloud with an undulating surface. Does each starling know what every other starling knows?. Together do all the FX traders have some common quality. Banks such as the BoE can draw lines and Soros can break them.

I can only test my assumptions by doing the maths and by making the predictions and seeing what happens each day.

As I wrote in my last comment. Not all the 24 levels are needed because some are duplicates and some are just 2 pips close so can be discarded. Tonight the VRM GBPUSD chart at the end of the day needed 7 weekly levels and 8 daily levels.


Your approach is based on the following assumptions.

1 - That the markets can be predicted
2 - That the way to make money in the markets is to predict a turning point in the markets
3 - That these predictions are mathematical in nature

You have assumed the above to be true. I would argue that all are demonstrably false.

For any market to stop trading in one direction and start trading in another, it will take the majority of participants (weighted by their clip size) to start behaving in a different way. You have provided no explanation of why they would - yet that is the basis for any trading method.

By drawing so many lines on a chart, then of course one of the lines will work - but as you are a mathematician, perhaps your next calculation should be....

How many times can you afford to trade failed levels and still be profitable from the ones that work?

I would go back and review the top 3 assumptions but most in your position will not because have they have so much sunk into this that they feel something will be lost if they hit reset. It's the old sunk cost fallacy...

I will end on one riddle that will help - because I do not just mean to trash what you are doing & you did mention atarlings.

If you mapped out 5,000 people in a shopping mall at 10:30am on a Saturday morning, how could you (mathematically or otherwise) tell where each of these 5,000 people would be in 15 minutes time?

The answer will lead you to where you should be focusing your efforts.
 
Last edited:
Your approach is based on the following assumptions.

1 - That the markets can be predicted
2 - That the way to make money in the markets is to predict a turning point in the markets
3 - That these predictions are mathematical in nature

You have assumed the above to be true. I would argue that all are demonstrably false.

For any market to stop trading in one direction and start trading in another, it will take the majority of participants (weighted by their clip size) to start behaving in a different way. You have provided no explanation of why they would - yet that is the basis for any trading method.

By drawing so many lines on a chart, then of course one of the lines will work - but as you are a mathematician, perhaps your next calculation should be....

How many times can you afford to trade failed levels and still be profitable from the ones that work?

I would go back and review the top 3 assumptions but most in your position will not because have they have so much sunk into this that they feel something will be lost if they hit reset. It's the old sunk cost fallacy...

I will end on one riddle that will help - because I do not just mean to trash what you are doing & you did mention atarlings.

If you mapped out 5,000 people in a shopping mall at 10:30am on a Saturday morning, how could you (mathematically or otherwise) tell where each of these 5,000 people would be in 15 minutes time?

The answer will lead you to where you should be focusing your efforts.
======================================================================

Thank you for your observations.

Following your assumptions....

1.) Everyone is trying to predict the markets. In John Murphy's book on technical analysis there are many ways to draw lines at different timescales carrying out many different types of analysis...Gann, Fibonacci, Wedge, Bollinger, RSI, Triangles.....and on. So are you saying that everyone's effort to predict the markets is futile?

2.) Many of the technical trading analysis methods are trying to predict the turning point in the market. These reversals can be used to start and end trades. Are you saying that trying to predict reversals is futile?

3.) Many trading indicators are mathematical in nature. Such as RSI, Gann and MAs. There is lots of maths out there. Are you saying that using maths is futile?

The VRM generates 24 weekly levels and 24 daily levels. There are large gaps. Surely it is worth the time to look for the large gaps and make that trade. You may have noticed that the sentiment levels labelled Sn are often bunched together. I call them the asteroid belt. When the market is within these levels then there will be lots of collisions with these levels as the market at different time scales fight with each other. Surely that information is useful.

Every night I present a set of levels where reversals could occur. If the maths is correct then this eliminates a lot of the real number system where reversals do not occur. And at 5 pm New York time I present the actual price action overlapping the VRM levels. The proof of the pudding is in the eating. To test the maths look at the results.

Finally your analogy of a crowd in a shopping mall. Interestingly mathematicians have tried to model that as well. See

http://reu.dimacs.rutgers.edu/2015/DIMACS-REU-Piccoli-2015.pdf

I would have enjoyed being at that presentation
 
GBPUSD predictions ending 5pm 2nd January 2018

I attach the VRM predictions for GBPUSD for tonight and tomorrow finishing 5 pm 2nd January in New York.

A description of the algorithm and format of the attached chart can be found in the first post of this thread.

For anybody interested in predictions for other FX pairs just follow the link at the end of these two documents.
 

Attachments

  • gbpusd.PNG
    gbpusd.PNG
    58.2 KB · Views: 242
======================================================================

Thank you for your observations.

Following your assumptions....

1.) Everyone is trying to predict the markets. In John Murphy's book on technical analysis there are many ways to draw lines at different timescales carrying out many different types of analysis...Gann, Fibonacci, Wedge, Bollinger, RSI, Triangles.....and on. So are you saying that everyone's effort to predict the markets is futile?

This is incorrect. Retail traders that don't make money are trying to predict the markets. That is not 'everyone'. All of the stuff you mentioned - Gann, Fibonacci, Bollinger, RSI represent failed attempts at trying to predict the market.

Think about this - which is statistically more likely at any point in time...

A) The markets will continue to do what they are currently doing
B) The markets will suddenly change and do something else

You are attempting to make money from B. Yet, you can make money from A. And we both know that A is more likely at any point in time.

The reason you are looking at B so hard is that you have been fished into the retail myth that trading is about finding a turning point in the markets.


2.) Many of the technical trading analysis methods are trying to predict the turning point in the market. These reversals can be used to start and end trades. Are you saying that trying to predict reversals is futile?

Technical analysis is the domain of sell-side finance. It exists to entice people to trade. So for example - when you see a technical analyst on TV explaining his view of the market - he is not a trader. He is someone employed to generate interest in the market.

Look up the difference between buy side and sell side finance. Then you will come closer to understanding the reason the information you are using exists.

3.) Many trading indicators are mathematical in nature. Such as RSI, Gann and MAs. There is lots of maths out there. Are you saying that using maths is futile?

Indicators do not work. Period. They have no predictive value. If one did - someone would have proven that it did. Did you ever wonder why there were so many of them in your average trading platform?

To be at the point you are at - you must have tested indicators and found them lacking already. After all why develop anything if you can just use a couple of Bollingers and a MACD?

Your conclusion - they just weren't the 'right' indicators - so you try to code your own up.

If 95% of traders fail and almost all the information you find about trading is technical analysis - use math to figure out the chance that you are really looking in the right place.

The VRM generates 24 weekly levels and 24 daily levels. There are large gaps. Surely it is worth the time to look for the large gaps and make that trade. You may have noticed that the sentiment levels labelled Sn are often bunched together. I call them the asteroid belt. When the market is within these levels then there will be lots of collisions with these levels as the market at different time scales fight with each other. Surely that information is useful.

No information is useful for what you are trying to do. You will always find yourself selling a market that is moving up and buying a market that is moving down.

Every night I present a set of levels where reversals could occur. If the maths is correct then this eliminates a lot of the real number system where reversals do not occur. And at 5 pm New York time I present the actual price action overlapping the VRM levels. The proof of the pudding is in the eating. To test the maths look at the results.

The only thing of importance in trading is....

- Why would traders behave a certain way after you enter?

Something you have not explained. You have no 'why' - only math.

Finally your analogy of a crowd in a shopping mall. Interestingly mathematicians have tried to model that as well. See

http://reu.dimacs.rutgers.edu/2015/DIMACS-REU-Piccoli-2015.pdf

I would have enjoyed being at that presentation

You see - this is where common sense comes into it. The answer to the question "how do you know where they will all be in 15 minutes is simple" - you set off the fire alarm. They would all be outside.

What you need to be doing is finding the markets fire alarms.

There 'book smarts' and 'street smarts. The best traders have more of the latter than the former.
 
Last edited:
This is incorrect. Retail traders that don't make money are trying to predict the markets. That is not 'everyone'. All of the stuff you mentioned - Gann, Fibonacci, Bollinger, RSI represent failed attempts at trying to predict the market.

Think about this - which is statistically more likely at any point in time...

A) The markets will continue to do what they are currently doing
B) The markets will suddenly change and do something else

You are attempting to make money from B. Yet, you can make money from A. And we both know that A is more likely at any point in time.

The reason you are looking at B so hard is that you have been fished into the retail myth that trading is about finding a turning point in the markets.


Technical analysis is the domain of sell-side finance. It exists to entice people to trade. So for example - when you see a technical analyst on TV explaining his view of the market - he is not a trader. He is someone employed to generate interest in the market.

Look up the difference between buy side and sell side finance. Then you will come closer to understanding the reason the information you are using exists.


Indicators do not work. Period. They have no predictive value. If one did - someone would have proven that it did. Did you ever wonder why there were so many of them in your average trading platform?


No information is useful for what you are trying to do. You will always find yourself selling a market that is moving up and buying a market that is moving down.


The only thing of importance in trading is....

- Why would traders behave a certain way after you enter

Something you have not explained.


You see - this is where common sense comes into it. The answer to the question "how do you know where they will all be in 15 minutes is simple" - you set off the fire alarm. They would all be outside.

What you need to be doing is finding the markets fire alarms.

But even better - just buy when it's moving up instead of always betting against the market.

Even better still - if 95% of traders fail and almost all the information you find about trading is technical analysis - use math to figure out the chance that you are really looking in the right place.

There 'book smarts' and 'street smarts. The best traders have more of the latter than the former.

=====================================================================

Thank you for your observations. You clearly have more trading experience that I. I have no more to add.
 
GBPUSD, EURGBP and EURUSD results 2nd January

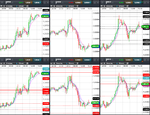
Last night I attached the predicted support and resistance levels of GBPUSD of the Volatility Response Model (VRM) for today. Today was a good example of GBPUSD, EURGBP and EURUSD with coordinated price action about their respective VRM levels.

So here are the results for GBPUSD, EURGBP and EURUSD. Weekly levels in the top 30 minute charts, daily levels in the bottom 30 minute charts. Times are GMT-4 . EMA channel (4,7) included.

Predictions for VRM levels of EURGBP and EURUSD together with 10 other FX pairs can be found at

https://www.complexhamiltoniansystems.com/fxcharts/

There were some large gaps between VRM levels to trade between.

Predictions for tonight and tomorrow to follow.
 

Attachments

  • 2018-01-02-GBPUSD-EURGBP-EURUSD.png
    2018-01-02-GBPUSD-EURGBP-EURUSD.png
    311.9 KB · Views: 278
GBPUSD predictions for 3rd January

I attach the VRM predictions for GBPUSD for tonight and tomorrow finishing 5 pm 3rd January in New York.

Predictions for VRM levels of EURGBP and EURUSD together with 10 other FX pairs can be found at

https://www.complexhamiltoniansystems.com/fxcharts/

Follow the link there to a description of the prediction format.
 

Attachments

  • gbpusd.PNG
    gbpusd.PNG
    58.2 KB · Views: 247
Does your indicator do indexes ?
If so, perhaps you would like to win some money on the competition thread ?

http://www.trade2win.com/boards/indices/227888-s-p-500-cash-weekly-competition-2018-prizes.html

Thank you for your invite to the SP500 competition. I am investigating whether the VRM algo predicts indices as well. FX is easier because of arbitrage

GBPUSD X EURGBP = EURUSD.

So the components of this triplet have to orchestrate their movements about three VRM level predictions. Are the DJIA, COMP & SP500 all coordinated as well? That`s a good question.
 
GBPUSD results for Jan 3

Last night I attached the predicted support and resistance levels of GBPUSD of the Volatility Response Model (VRM) for today.

Here are the results for GBPUSD. Weekly levels in the top 30 minute charts, daily levels in the bottom 30 minute charts. Times are GMT-4 . EMA channel (4,7) included.

High for GBPUSD today was the weekly level 1.3608 calculated last weekend.

Low for today was the daily level 1.3506 calculated last night.

The weekly level 1.3526 stopped the GBPUSD from rallying.

There were some large gaps between VRM levels to trade between.

Predictions for tonight and tomorrow to follow.
 

Attachments

  • 2018-01-03-GBPUSD.png
    2018-01-03-GBPUSD.png
    105.9 KB · Views: 271
Thank you for your invite to the SP500 competition. I am investigating whether the VRM algo predicts indices as well. FX is easier because of arbitrage

GBPUSD X EURGBP = EURUSD.

So the components of this triplet have to orchestrate their movements about three VRM level predictions. Are the DJIA, COMP & SP500 all coordinated as well? That`s a good question.

Yes as a matter of fact .
There is the average and the weighted average which assesses the past results of each player.
 
GBPUSD, EURGBP and EURUSD results 4th January

Last night I attached the predicted support and resistance levels of GBPUSD of the Volatility Response Model (VRM) for today.

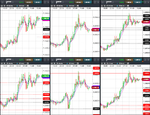
Here are the results for the triplet GBPUSD, EURGBP and EURUSD.

Weekly levels in the top 30 minute charts, daily levels in the bottom 30 minute charts. Times are GMT-4 . EMA channel (4,7) included.

EURUSD hit weekly VRM level 1.2083.
EURGBP hit daily VRM level 0.8922
GBPUSD was supported by weekly VRM level 1.3537.

There were some large gaps between VRM levels to trade between.

Predictions for tonight and tomorrow to follow.
 

Attachments

  • 2018-01-04-GBPUSD-EURGBP-EURUSD.png
    2018-01-04-GBPUSD-EURGBP-EURUSD.png
    391.9 KB · Views: 276
GBPUSD predictions for 5th January

I attach the VRM predictions for GBPUSD for tonight and tomorrow finishing 5 pm 5th January in New York.

Predictions for VRM levels of EURGBP and EURUSD and 10 other FX pairs can be found at

https://www.complexhamiltoniansystems.com/fxcharts/
 

Attachments

  • gbpusd.PNG
    gbpusd.PNG
    58.4 KB · Views: 261
Top