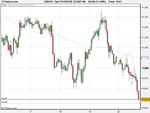
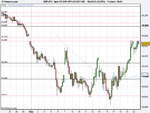
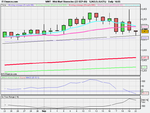
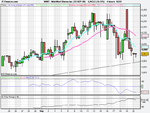
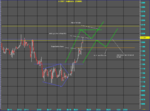
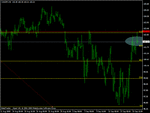
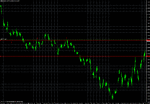
Pursuant to the trade TD made over in his journal, I am highlighting the price action of Soybeans.
** before you all atart giving me grief, I'm not taking any credit for this at all. This is the first time i've looked at a soy chart this year**
anyway, i mention it to highlight some chart patterns that dont get much mention; namely Diamond patterns and broadening megaphones (pretty self explanatory).
Not sure the pattern I've drawn here counts as either, strictly speaking, looks more like a good old fashioned pentagon rather than anything else. Still, the point is this; TD got stopped out from an IB setup; the whole PA is interesting here, from the dailies (both inside and outside bars), the 240min pattern shown, and the hourlies too.
FWIW, if I was going to trade this (which I'm not, not my market), I would be looking for a long on abreak @ retest - or a test of R2S if it trades straight through - of the pivot in at 1150 ish.
All credit goes to TD for spotting it, and my disclaimer is that I'm not calling a trade; rather a "potential potential setups".
p.s. if you are really interested, look up something called "harmonic" patterns,like ABC or Gartley, which I think this may be, though I can't test it for sure. Also, think about Cup and Handle or crown patterns. NOTE, i dont use any of these at all, they are just educated guesses.
the point is, there is lots going on here.
