Best Thread Potential setups

Status
Not open for further replies.
imo it's an experience thing. It was a good bar at a level, but I was short about 10 minutes after it formed - the whole round top said to me that we were going down, it just didn't feel right.

Just keep taking them until you can tell. I pass on a lot of bars that work too so...

Even with trades like this, it'll work on balance - the trades that work will more than pay for it.

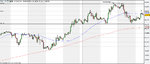
what you think of cad/yen 'shack?

I'm thinking the pin was from stop hunting the more i look at it but its made slightly higher highs and i think we've got to be nearing the bottom of the daily range by now.
 
Last edited:
should be good for 84 imo

ES was actually a nice S/R flip on lower TF
 
Last edited:
AUDJPY H4 setup

AUDJPY has formed a clean pivot @ 76.13. Go to lower TFs to see it was a clean touch. A pinbar has formed on H4, and there is a 38.2 fib confluence from recent low making this a picture-perfect retracement before continuing up. Targets: 77.51 (support from Hourly) / 79.49 (recent high).

Note: on the Weekly the price reached 50% fib level from major low, so it can go either way. If the H4 setup fails, there may be an opportunity in two days on the Weekly TF.

Ilya
 

Attachments

  • 2009-06-03 audjpy d1.gif
    2009-06-03 audjpy d1.gif
    15.6 KB · Views: 138
  • 2009-06-03 audjpy w1-2.gif
    2009-06-03 audjpy w1-2.gif
    15.4 KB · Views: 139
  • 2009-06-03 audjpy h4-3.gif
    2009-06-03 audjpy h4-3.gif
    16.6 KB · Views: 146
Last edited:
imo it's an experience thing. It was a good bar at a level, but I was short about 10 minutes after it formed - the whole round top said to me that we were going down, it just didn't feel right.

Just keep taking them until you can tell. I pass on a lot of bars that work too so...

Even with trades like this, it'll work on balance - the trades that work will more than pay for it.

Spot on answer.

It was a good pin at a good level. But when I look at the daily TF, I just don't want to be long and it didn't feel right for me.

I also pass on a lot of bars that work...look at my post to Aaron the other day...I told him the Cable pin he called on the hourly was a sh*t setup (not in so many words lol) and yet it went parabolic...

It will def work on balance. If you are taking 2:1 on your trades, you need to be right less than half the time to come out ahead.
 

Attachments

  • cable.gif
    cable.gif
    23.2 KB · Views: 215
What about Dow Jones? Is anyone long there?

Price has find support at the break of the box between 8.200 - 8.600.

4hr looks interesting with a twizzer bottom and confirmation of that level as support . If the level holds there we should see 9.000 soon..
However, that daily evening star makes me worried and think in a more bearish way..

Hoe do you guys see it?
 
I might have a crack at shorting the Nasdaq tomorrow.

Also looking for an hourly retracement to short GBP/USD, AUD/USD and buy USD/CAD.
 
What about Dow Jones? Is anyone long there?

Price has find support at the break of the box between 8.200 - 8.600.

4hr looks interesting with a twizzer bottom and confirmation of that level as support . If the level holds there we should see 9.000 soon..
However, that daily evening star makes me worried and think in a more bearish way..

Hoe do you guys see it?

I play the indices long term. I'm waiting to short. You may want to go long to 9050ish, but I'd want it to break the January highs to really call the bear market rally into question.

Maybe breaking yesterday's high would be a decent entry if you really want to go long, but I don't want to be long when the correction that I expect comes.

cheers
 
What about Dow Jones? Is anyone long there?

Price has find support at the break of the box between 8.200 - 8.600.

4hr looks interesting with a twizzer bottom and confirmation of that level as support . If the level holds there we should see 9.000 soon..
However, that daily evening star makes me worried and think in a more bearish way..

Hoe do you guys see it?

or a more simple awnser, it bounced off the daily 8ema
 
Spot on answer.

It was a good pin at a good level. But when I look at the daily TF, I just don't want to be long and it didn't feel right for me.

I also pass on a lot of bars that work...look at my post to Aaron the other day...I told him the Cable pin he called on the hourly was a sh*t setup (not in so many words lol) and yet it went parabolic...

It will def work on balance. If you are taking 2:1 on your trades, you need to be right less than half the time to come out ahead.


May I ask you why you didn't want to be long? Didn't you feel a rebound to be realistic?
If we take a look to the chart ex-post we see that the rebound took place some hours later on a lower level (around 923). The high of June 20 acted as support (see black line on attachment).
 

Attachments

  • screen-capture.gif
    screen-capture.gif
    22 KB · Views: 189
Gbpusd

Cable finds support in the late asian/overnight session around the 38.25 of the 5507-6661 rise after yesterday's sharp sell off from that 6661 hi. Nice bullish divergence plays in time frames up to 1hr with supporting hidden divergence in the 4hr at those levels.

The rebound from the 6207 level lo has been strong price exceeding the 23.6 and 38.2% levels of the 6661-6207 sell off as well as most obvious 1hr/4hr previous swing lo=prev supp=potential sbr zone 6320-71 that had acted as resistance in the overnight session for the last leg down to 6207 (That prev 1hr swing hi now becomes a potential rbs zone.) The latest leg up helped by better than forecast Uk halifax hse price data released at 0900 london.

Below is the 1hr chart in respect of prev obvious near term imbalances of supp/dem and dem/supp, fibs/t-lines.

G/L

25u5gz9.gif
 
gbpusd

0822 GMT [Dow Jones] GBP/USD is up 2 cents from it's Asia low of 1.6418 and now looks overdone says a trader. The latest spike follows a strong Halifax house price survey while the initial rise seems to have been a mixture of short covering after GBP/USD's 4 cent overnight slump and a rise in risk appetite thanks to firmer equities. He favors a return to the day's low of 1.6211 and would sell at market with a stop above 1.65. (GST)
 
gbpusd

Price is finding resistance at the 50% fib of the 6661-6207 fall in that pevious 1hr minor swing lo=prev supp=potential sbr zone, also mni were touting offers 6435/40. Nice bearish divergence plays on 1 and 5min with an inside bar on 5min. How strong is this uptrend that currently only extends to 5min, arguably 15min, off strong move off 6207 lo?

t5sv9s.gif
 
Last edited:
peak of EURUSD right shoulder for potential H&S. formed 2hr doji/pin bar.
i got in a little bit earlier off 30min inside bar.
 
EUR/USD possible H+S forming on the 1hr?
 

Attachments

  • EURUSD2.jpg
    EURUSD2.jpg
    182.8 KB · Views: 165
Gbpchf

It's not exactly pin-baring, but you may want to watch the PA around 17504. I have that as last year's support and this year's resistance. It recently broke to the upside, but went down and is now testing the level again from underneath.

cheers
 
gbpusd

0945 GMT [Dow Jones] "Can we assume the sterling rally will be maintained?" ask analysts at BNP Paribas. "Yes, over the summer months, but a clear no... going into autumn and winter." The rally in equities is vulnerable, and the lack of household leverage will hamper the UK in future, the bank says. And a weak currency is needed to keep the economy afloat. "Hence we would not get carried away by current sterling strength. It might just be the final opportunity to sell." GBP/USD trades at 1.6408. (KJM)

Who will sell the 1hr inside bar at the 50% fib of 6661-6207?? Uk Boe/Mpc rate decision ahead, N/c almost ceratin @ 0.5%, some further info on quantitative easing?

35lxhlv.gif
 
Status
Not open for further replies.
Top