Best Thread Potential setups

Status
Not open for further replies.
Hi Grim

I had a bit of time watching the rain come down and thunder today in Strasbourg...I saw your chart and thought about adding my take.

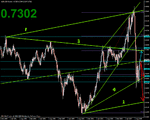
I drew two lines, marking top (1) and bottom (2) long term trend lines...which are also parallel to your central trendline.

I also drew a descending line (3) through the lower highs that also has confluence with the 38% Fib line that you drew.

Fundamentally, if the main markets fall (dollar positive) and gold rises at the same time (Rare and AUD positive) then we might fall to the trendline (4) that you drew...if gold falls with the general market then we could be heading back down towards the lower trendline (2) I drew.

If the stock markets continue to rise and the carry trade re-establishes...then a rise to test the trendline 3 and then upwards even further? This would establish it's long term historical range.

I'm just a novice but I love long term charts...would appreciate the views of any more experienced traders.

We might also be approaching a generational opportunity to short the Yen.
 

Attachments

  • aussie monthly artful.gif
    aussie monthly artful.gif
    33.2 KB · Views: 173
Sure, there could be a few pips if you trade the hrly or dly against the trend - but it's always dangerous - much better to just wait and protect your account by trading with the trend![/QUOTE]

this has more to do with cycles than trends.
 
Yeah, I think I'll sit aside on Monday and look for a sell signal. Pulled up the weekly chart today, and we're at a key level at the moment. This level has now been tested from above 7 times since November!!!

Bonds across the board are way over priced with ridiculously low yields. Once all the quantitative easing starts increasing money supply, I believe we will be facing some significant inflation, forcing the yields of bonds up and prices down, WAY down.
Forex Guides
 
Shown below are the near term imbalances of supply/demand and demand/supply represented on this 1hr chart by the previous swing Hi & Lo areas. Current unbreeched fibs of 3 major swings up from and including 4396 swing lo are shown as well as 1hr trend lines too.

To the upside the 1hr 4927-45 previous swing hi zone co-exists with a 4900-4945 4hr zone.

Not seen on the chart:
5033-5066 Previous swing hi zone 1hr and 4hr with the 23.6% fib of the 0157-3505 fall at 5063.

5106/16 area - 2 x fibs, being 50% 6696-3505 and 23.6% 0395-3505 falls.

5186 is 76.4% of the 5711-3505 fall

5225-5375 a Previous swing hi zone on Daily chart with 23.6% of 1162-3505 fall in there at 5301.

5474 is a 2 x fib cluster 61.8% 6696-3505 / 38.2% 8672-3505

280iczc.gif
 
Last edited:
From Moneyweek this Friday's edition:
US Insiders aren't buying the rally

The S&P has jumped more than 30% since mid-March....but corporate insiders - who should have a better handle on the prospects for their company than analysts and economists - don't seem to share this optimism. In the 1st 3 weeks of Apr execs and senior officers at US firms sold $353m of equities - 8.3 times more than they bought....slowest insider buying since July 1992. The pace of the selling was the fastest since the stock market peak in Oct 2007.

Just for info :)
 
Last edited:
PS Just for info - from Mark Marber's book - Marber on Markets.

Trend lines - his rules (he was involved in the markets for 50 years) for TLs state the 'rule of 4'
So, you need 4 pivot points in a move before you can draw a TL - for a rising TL you would need a Low, High, Higher Low and Higher High before you could draw a TL - reverse for a descending TL.

Also, he states that in Forex a TL is only violated if PA goes thru that TL by more than 1% - 1.5% for commodities and 3% for shares.
 
From Moneyweek this Friday's edition:
US Insiders aren't buying the rally

The S&P has jumped more than 30% since mid-March....but corporate insiders - who should have a better handle on the prospects for their company than analysts and economists - don't seem to share this optimism. In the 1st 3 weeks of Apr execs and senior officers at US firms sold $353m of equities - 8.3 times more than they bought....slowest insider buying since July 1992. The pace of the selling was the fastest since the stock market peak in Oct 2007.

Just for info :)

I agree with this Grim but I get a feeling here that there are some who did not buy before and are starting to panic that they have missed the boat and will start buying now and push the indices up higher to an exhaustion before we drop. Not something Im going to trade on but a possibility ...
 
Hi Grim

I had a bit of time watching the rain come down and thunder today in Strasbourg...I saw your chart and thought about adding my take.

I drew two lines, marking top (1) and bottom (2) long term trend lines...which are also parallel to your central trendline.

I also drew a descending line (3) through the lower highs that also has confluence with the 38% Fib line that you drew.

I was interested to see where my trendlines were...and noticed that if you draw your line number 3 not from the high in around 1989, but from an earlier high in 1986, then there is a channel formed with a parallel line from a 1985-ish low to one in 2000.
 

Attachments

  • audusd mth mt4 090502.gif
    audusd mth mt4 090502.gif
    29.8 KB · Views: 166
From Moneyweek this Friday's edition:
US Insiders aren't buying the rally

The S&P has jumped more than 30% since mid-March....but corporate insiders - who should have a better handle on the prospects for their company than analysts and economists - don't seem to share this optimism. In the 1st 3 weeks of Apr execs and senior officers at US firms sold $353m of equities - 8.3 times more than they bought....slowest insider buying since July 1992. The pace of the selling was the fastest since the stock market peak in Oct 2007.

Just for info :)

Totally agree with this and I think that cable shall tank well, due to the equities down fall and other factors too. I shall post some charts later, as I am of the opinion that cable is in the sell zone offering nice short entry points with relative small SL, therefore a high probability trade/s.
 
I think this rally is the real deal - Heres why...

Day-traders are bouncing the lower-trendlines of the FTSE100 so thats unlikely to break while the pros are enjoying the easy pips on the way up.
Gradually the media is indicating improvements and therefore people who don't trade, who will see the market as oversold will slowly put their money in and forget about it.
With no break of the lower-trendline, people in their current positions won't feel the need to get out and have a feeling of 'Well, may aswell keep it, this may be the bull'.

When enough people are waiting to 'see' if its a bull, with current positions and no break of an important lower trendline that has sustained past a false breakout. I can't see how this rally is going to crash.

Furthermore, if you look at the last bear market and how it recovered... It looks very similar, i actually showed it to my dad who trades the FTSE100 and he didn't know it wasn't the current market lol

If slowly people are putting money in outside the trading world - and traders are holding positions, hoping this is the bull market for big profits, and day-traders are enjoying the ranges...

Whats going to bring it down?

Bad US news maybe. But these highs were hitting, if broken... I'm bull.

When Money Week and analysed start saying this rally is a dead cat bounce, it got me thinking thats its probably not... They are usually wrong and don't care either, i bet they have all their long positions on, holding just incase.

There is an analyst who every single rally has called in the bull market and been wrong, except this one.

Oh well, whatever, it won't affect the way i trade either way.
 
Sure, there could be a few pips if you trade the hrly or dly against the trend - but it's always dangerous - much better to just wait and protect your account by trading with the trend!

this has more to do with cycles than trends.[/QUOTE]

Care to elaborate further? Cycles are not Elliiot Waves are they??
 
fwiw, this is what I meant ^

Obviously the best entry was on a lower timeframe, not waiting for 30minute bars to close because by that time you've already missed 30 points.

DOW up almost 200 points from that entry.

Trader_dante was right when he said it was free money on Friday and it's free money today.
 
Hi, daytrader!
In my opinion, GBPJPY has good potential to run downwards.....The abrupt trendline has been broken and on H4 - shooting star....Let's look ... sorry for my bad english
 
Gbpjpy

I agree, 4hr trendline broken. I have levels at 1.4650, 1.4550 and 1.4480
Tough day for this pair with JPY and UK holiday but looks to be good, Im short
 
Status
Not open for further replies.
Top