Best Thread Potential setups

Status
Not open for further replies.
hi grim,are you talking about trading the shakeouts??if so iv come to take them almost as trading signals to trade in the opposite direction to the false break,especially the intraday patterns.i trade short tf patterns regularly and i think youlle find youlle get stung playing these that way as they mostly break nice n clean and fast!!
my experience with the longer term patterns is that they rarley give out what they promise,and are much more likely to ret into the pattern,wether they eventually break or not.(y)
hope this helps
Hi Jonj

Yes, exactly that. I'm not sure if it's just choppines thru indecision but I have found a few b/o's that have been false so I tried a couple of times to go against the b/o and managed to scavange a few pips. Then I change and like you have said trade in the opposite direction to the shake out. I try and confirm the b/o by using the MACD or the Force Index for any convergance/divergance that would go against the b/o direction.

May be risky as I have not tested it as a valid strategy long term, more a short term obesrvation
Grim
 
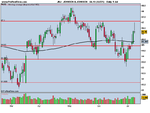
might be worth watching this afternoon
 

Attachments

  • JOHNSON & JOHNSON.png
    JOHNSON & JOHNSON.png
    10.8 KB · Views: 280
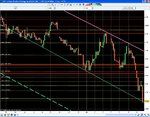
Russell 200 Daily Short setting up , it triggers today. Thanks to (YKW) for spotting it.

Just a follow up on rollsafes call on the Russ 2k.

It's a great illustration of how this strategy works. Some trades really go the distance and you need to be patient to see them out.

That's a daily TF chart. And a lot of money.

:)
 

Attachments

  • russ2k.jpg
    russ2k.jpg
    83.1 KB · Views: 317
are you actually getting any work done tom :LOL:

In between drinking coffee, smoking, eating, writing on here, checking Facebook and working my way through the excellent "Day of the Triffids", I do manage to place a trade, superspurs ;)

I prefer to let the scalpers work all day for a living. We can all pace a trade and do something else with our precious time!
 
super.it seems to me trading stocks gives you s big advantage with the addition of volume,do you find it helps a lot in your decision making??

anyway heres a decent looking dblhc on the gb/us 4h chart.
the hourly shows an ib at the mo,could provide a nice entry??
 

Attachments

  • update.gif
    update.gif
    26.7 KB · Views: 208
Just a follow up on rollsafes call on the Russ 2k.

It's a great illustration of how this strategy works. Some trades really go the distance and you need to be patient to see them out.

That's a daily TF chart. And a lot of money.

:)

Are you still working for the man, or are you earning the big money with us independant compounding traders?
 
I missed this v.low close doji and inverted hammer combo on Lehman Bros as i went out for a walk and then had dinner. :(

The highs of the two bars were a 50% retrace of the opening high/low swing print.

Anyway, a very nice example nonetheless. :)
 

Attachments

  • Lehman Bros 1hr pins 100708.JPG
    Lehman Bros 1hr pins 100708.JPG
    222.3 KB · Views: 200
Last edited:
super.it seems to me trading stocks gives you s big advantage with the addition of volume,do you find it helps a lot in your decision making??

i have the volume on my charts,but to be honest i don,t know how to interpret it just yet.it is there in case of a volume spike that might grab my attention at a s/r level.
 
Superspurs.
The volume is like an open ticket to the workings of the smart money. Quite often you may see a down move on a bars over a few days but no large volume to accompany it (compared with the volume around it). This often means the smart money is not interested in selling at that price for example. I was always told that strength was shown on down days and weakness on up days. If you have an up move that is accompanied by large volume with a large spread it can mean the big money is in the move as they are the only ones that can move the price that much.
You can look for signals such as:
1. An up day bar, into new high ground with a narrow spread on high volume; often indicates pro money selling the longs into the crowd at the end of an up move.

2. A down day, into new low ground with a narrow spread on high (but not excessive) volume often indicates a bottom

The key to volume analysis is also in the spread (HLC) of the bar. For example, if you have a wide range bar on high volume but the close is in the centre of the bar it could indicate that pro-cash has stepped in and bought up the weak hands selling. It will often be confirmed by the next bar. If it's a down bar with a close at the bottom on low volume then it could indicate that pro-cash was indeed buying the market on the bar before, so a bullish signal.

The only issue with Forex is the lack of volume data due to the non centralised nature of the markets. The COT report released every Fri is the best indicator of future forex activity in the next week that I have found!

I have not quie mastered it yet but I have a excellent read on the subject called 'The undeclared secrets that drive the stock market' by Tom Williams. His url was www.TradeToWin.com so I'm not sure if it was an early version of this site??
Grim
 
thx grim,from what you are saying if i understand right,in 1&2 are these morning and evening star patterns
 
thx grim,from what you are saying if i understand right,in 1&2 are these morning and evening star patterns

Yes, I suppose they are. In Tom's book he use HLC bars but candles convey the same info!
Have you read the article from this site below:
T2W Day Trading & Forex Community
Worth a read too. Again, no use really in forex as the volume is not displayed. This is why 'they' reckon many FTSE traders who switch to forex fail as they are robbed of their volume info!!
I'm thinking I trading volume info but I need to find a software provider. At the moment I think that sharescope is the best from all the demos I have seen. I think I would only need EOD data as that style fits my trading style for FTSE as I have a day job!!
Good Trading
Grim
 
help required from pinbar traders

Hi all,

Maybe the more experienced pinbar traders can help me out.

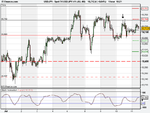
the attached chart shows an hourly pinbar yesterday for usd/jpy.

1. Was this a valid pinbar despite being stopped out?

2. If it was a valid pinbar, would you have reattempted a short after being stopped out?

Cheers,

R2R
 

Attachments

  • Spot FX USD_JPY (11-JUL-08).png
    Spot FX USD_JPY (11-JUL-08).png
    17.7 KB · Views: 199
Hi r2r,

Its definately a pin bar, but its a bit short. Look at the length of the nose compared to other candles tails in the recent area, its not much different. Then look at http://www.trade2win.com/boards/att...15670316-potential-setups-johnson-johnson.png that, spurs posted yesterday, the nose is a lot longer than pretty much any other bars tails on the whole chart.

When you see a big pin, to me it means something unusual has happened, short ones might just be the random market moves disguised as a pinbar so I wouldnt reenter it myself.(y)
 
Status
Not open for further replies.
Top