supremegizmo
Active member
- Messages
- 219
- Likes
- 86
preamptive h&s play for euro comin
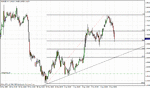
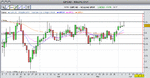
this is one of my fav trades of preamptive h&s patterns
i am expecting euro to bounce of 1.3350 area and when it rallies we hit the euro at 50% move and put our stops above 61.8% fib of head move
in this way you will be trading a potential h&s pattern turn your way and dont have to trade a break of necklines .. instead if all works in ourfavour then we add more on a confirmed break of neckline ...
traders this is highly speculative .. you should only trade if you can read price actions at fib levels and not blindly hit the fib levels AND ALSO know the reverse fib theory aswell
best of luck
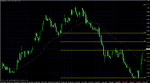