You are using an out of date browser. It may not display this or other websites correctly.
You should upgrade or use an alternative browser.
You should upgrade or use an alternative browser.
Best Thread Potential setups
- Thread starter trader_dante
- Start date
- Watchers 274
- Status
- Not open for further replies.
superspurs
Established member
- Messages
- 618
- Likes
- 139
trader_dante
Veteren member
- Messages
- 4,535
- Likes
- 1,704
Hi Tom,
Good idea for a thread - but may I request some clarification please?
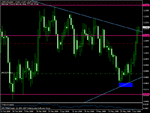
Which is the set up in the chart in your opening post - a reversal, continuation or both? The long term trend indicated by your red trendline is clear as day, so a short (say around the breach of the recent higher low) would constitute a continuation. However, a swing trader who's been long up to this point would view the same trade as a reversal. I'm deliberately being obtuse because until the terms 'reversal' and 'continuation' are defined, they'll mean different things to different people. Add to this the different timeframes and trading styles, the waters become very muddied very quickly!
Tim.
Hi Tim,
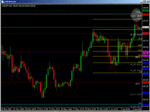
Well, I have these areas on my charts and I watch the price action as the market trades into them. The market can either tip its hand that this is a reversal area, it can consolidate beneath and indicate a possible breakout or it could even break out and then retest to indicate a continuation. How the trader plays the market is up to them but for me the important point is to highlight the areas where key levels come together. This stops traders jumping on momentum in "no mans land" where direction is harder to determine in my opinion.
superspurs
Established member
- Messages
- 618
- Likes
- 139
tom,i thought you closed the other thread to give yourself more time,if so take a hike 😆
graemenash
Active member
- Messages
- 144
- Likes
- 18
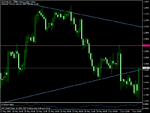
Hope this isn't muddying the waters a little, but should that trendline break on USDJPY there is a decent cluster of resistance just above. In an area of approx. 40 pips, we have the weekly and monthly R1 pivots, the 38.2 fib of the move from 124.13 down to 95.73 and also the 123.6 extension of the most recent downswing in this sequence of higher highs and higher lows up from the bottom.
With the weekly chart still in a clear price action downtrend and showing good hidden divergence, plus good regular divergence on daily and 4h charts, there could be a good opportunity to sell. However that also applies to the current situation as the market bounces around that trendline from the first post in this thread.
With the weekly chart still in a clear price action downtrend and showing good hidden divergence, plus good regular divergence on daily and 4h charts, there could be a good opportunity to sell. However that also applies to the current situation as the market bounces around that trendline from the first post in this thread.
Attachments
lol jonj, you trying to spook me
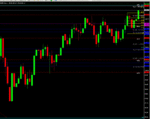
lol,heres my daily,i dont see the 10200 on yours,might want to check it out.could yet break to the upside,any thought on how to playn this.?
Attachments
superspurs
Established member
- Messages
- 618
- Likes
- 139
the round no. does seem to have an affect though,lets see what happens.:?:
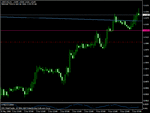
the minor support you mentioned is also the 61.8 fib from the last daily swing high on the 1st april.(nice pin also🙂)
shame about the pin,i had high hopes for that last hourly candle!!lol
the minor support you mentioned is also the 61.8 fib from the last daily swing high on the 1st april.(nice pin also🙂)
shame about the pin,i had high hopes for that last hourly candle!!lol
Attachments
Last edited:
superspurs
Established member
- Messages
- 618
- Likes
- 139
superspurs
Established member
- Messages
- 618
- Likes
- 139
makes me think of firewalker,mark price up to res then sell off perhaps
trader_dante
Veteren member
- Messages
- 4,535
- Likes
- 1,704
OK, listen up folks, I just paid £230 so you don't have too 🙂
Never put in a buy or sell order UNTIL the candle has closed and the new one has opened.
USD/JPY was forming a beautiful pin and I put a sell order in about 2 minutes before the close. Trichet said something. the market sold off, my order was triggered then it reversed rapidly on me. When the candle closed the bar looked all wrong and wouldn't have been something I wanted to participate in.
As soon as I saw this I got out but it still hurt.
Be careful of this!!!
Crap Buddist
Senior member
- Messages
- 2,458
- Likes
- 289
Never put in a buy or sell order UNTIL the candle has closed and the new one has opened.
Yeah nice one, I use 1 minute charts so they close a bit quicker 🙂 But guys trading off hourlies or 4 hourlies gotta wait for the close . I dont like that, its toooo long in my book. even on 1 minute bars price can whip 20/30 points in 10/20 seconds.
which is hairy enough.
hourly or 4 hourly closes? range can be hundreds of points...
wait for close.
Mind you some peeps say Close ? the price never closes?? so why relate to any close on any timeframed bar at all ?
I like to reach for a beer at that point. 🙂
K
kenobi
wait for close.
Mind you some peeps say Close ? the price never closes?? so why relate to any close on any timeframed bar at all ?
finally, something intelligent in this thread.
graemenash
Active member
- Messages
- 144
- Likes
- 18
trader_dante
Veteren member
- Messages
- 4,535
- Likes
- 1,704
Mind you some peeps say Close ? the price never closes?? so why relate to any close on any timeframed bar at all ?
Of course you're right. Price is in continuous motion and therefore the close becomes simply a frame of reference.
trader_dante
Veteren member
- Messages
- 4,535
- Likes
- 1,704
finally, something intelligent in this thread.
Intelligence matters little in trading Kenobi. Come on, you should know that.
trader_dante
Veteren member
- Messages
- 4,535
- Likes
- 1,704
Surely you're not seriously saying that's the only lesson you will take away from that incident? What if Trichet had actually started speaking 2 mins AFTER the bar closed, not before?
That would be a different scenario for me GJ. Experience tells me that the news usually follows the direction the price is going in when it triggers one of my setups.
FXSCALPER2
Established member
- Messages
- 964
- Likes
- 281
Surely you're not seriously saying that's the only lesson you will take away from that incident? What if Trichet had actually started speaking 2 mins AFTER the bar closed, not before?
I would have thought a better lesson to take away from this is that when people are largely positioned one way, and a credible figure such as a central banker comes in and says something that messes up ALL their positions, you're better not be caught long n wrong as the fundamentals will blow away the technicals.......
Just my $0.02
GJ
Very ture. Given what Trichet said, technicals meant diddly squat.
FXSCALPER2
Established member
- Messages
- 964
- Likes
- 281
That would be a different scenario for me GJ. Experience tells me that the news usually follows the direction the price is going in when it triggers one of my setups.
If Trichet comes along and says 'hey, we gonna put interst rates up' or Bernie says 'we are attentive to USD decline', your TA will be completely meaningless.
- Status
- Not open for further replies.
Similar threads
- Replies
- 2
- Views
- 8K


