Best Thread Potential setups

Status
Not open for further replies.
There is one number I am interested in gold and that is $930.

Me too, been watching it for a couple of weeks for a trade.
Thing is, I find gold is not always so easy to trade, but when it gets
a head of steam, off it goes...its happened before & will happen again.

Also long term outlook for buying gold and gold mining shares is good.
Govts are printing money = inflation
Gold coins are getting to be hard to come by.
 
CAD employment figures came in 60K less than forecast!! Could be fun at US NFPs this afternoon!
 
NFP Circus rolls in at 1330pm gmt

Attached is the 1hr gbpusd chart. white horizontal lines are the ascending support trend line (hit and hold x 2 now circled in white) -and- the current channel top,...(hit and hold x 2 circled in white.)

2vlv337.gif


Bit of fun:

a. Straddle- Orders above/below red/green extremes of most immediate previous price swings.

b. Buy the cash/sell the futures of same instrument with stops or no-stops, closing out one when direction becomes clear, let other run

c. buy eurusd, buy also correlated usdchf, see b. above

d. Entry on close of first 15min thrust candle.

e. Await first pullback to potential sbr/rbs and enter

------------------------------------
d. or e. are the only 2 I might be involved in, depending on price action/reaction to data.
 
Yep, still bearish...but I've taken 153 ticks out of it today on the long side so not too bad.

Still holding some longs from lower down.

Well if you're going long, then I guess the bearish bias doesn't matter... besides I don't know what you're timeframe is on that 7450, next week, next month?
 
Well if you're going long, then I guess the bearish bias doesn't matter... besides I don't know what you're timeframe is on that 7450, next week, next month?

Well, my bearish bias is very much based on the price.

Obviously we are in an overall bear market right now but there has been very good support on the YM around 7800 and clearly in the meantime, it wants to hold.

Sentiment may be slowly shifting. You know the drill FW, we'll all hear about the positive fundamentals long after price has bottomed and rallied significantly.

I think that for me to lose most of my bearish bias I would have to see the Dow above 10k.

The last vestiges of bearishness would only be wiped out on a Dow above 12k.

what would you say if the dow is headed below 2500 as some gold bugs say??
 
I think it's now buy the dip rather than sell the rallies, we'll see, but sentiment has definately shifted, and the focus is more on bailing out the banks than the overall stimulus package.
 
I'm pretty sure sentiment has shifted.
bad news is not impacting the markets.
retail investors are forgetting the pain of their losses and jumping into the market with
renewed optimism.
This means the fund managers willbe getting active.(its happening already)
This is the shift of sentiment.
I don't think this means its the end of the bear market and certainly not
the end of the bad news for the economy.
But this could be the beginning of a significant bear market rally.
Which, if it happens,will seem like a bull market for a while.
if this happens enjoy it but don't be suckered into thinking bad times are gone forever.
As for sectors, I've a feeling miners will be an early winner. But so far thats mostly a hunch.
 
News Trading

A couple of people asked me about news trading yesterday in the FX500 Club room and asked for examples. I think the best example of the strategy (as taught my MP1040 I think it was before he was banned for some reason!) was given yesterday on the CAD job figures.

The set up is basically driven off the 4hr chart. As normal you will mark your charts (CADYEN / USDCAD in this case) with the normal SIGNIFICANT levels of S and R.

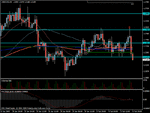
Then you look at the direction of the 4hr trend prior to the release. As you can see on the chart below the USDCAD direction was UP.

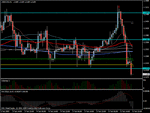
Look for the significant S&R (1.2500 on my charts) that the price will be driven too. Wait for the breach of the level (I wait for 1 15m TF period for the PA to settle down) and then SELL as the price falls back. (or buy in the case of the price being driven down)

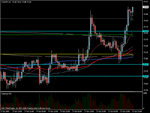
As you can see on my charts at 1200 (time of news release) the PA shot up on USDCAD and fell on CADYEN. Wait for the area of S or R to be touched and then get into the trade in the opposite direction to the news driven move. The reversal can clearly be seen on both pairs. CADYEN fell initially hit the 20ema and SR level then reversed and shot up.

Targets are either where price started prior to the news of the next significant FIB or SR level.

Now I realise this type of trade will not be for everyone as it does involve a dash of risk; this risk can be reduced by waiting for a pin or tweezer bottom to appear or for the risker trader use the top of the move to give the max RR ratio (use Stochastics for oversold/bought).

As you can see both trades yesterday paid off rather well will some 300 pips on USDCAD in a matter of 7-8 hrs. Look how it targeted the lower S level at 1.2220. I closed the position there for 285 pips. Others may hold longer to see where it went.

The secret is to ignore the initial news move and wait for the reversal. This type of news trade keeps you being whipsawed out on news releases as you are not in the market at the time of the release. The only time I tend to use this is on the BIG releases like GDP and employment figures.

Try it out but make sure you 'dry-run' it first! Like I say, it won't be for everyone.
Happy pippin!
Grim
 

Attachments

  • cadjpy news bounce.gif
    cadjpy news bounce.gif
    21.1 KB · Views: 171
  • usdcad news bounce h4.gif
    usdcad news bounce h4.gif
    22.7 KB · Views: 171
  • usdcad news bounce.gif
    usdcad news bounce.gif
    22.8 KB · Views: 184
Is there a potential good pin on eurusd H4 ?

Its around about 78.6 fib from previous swing down, although it does have a small lower shadow.

Area is previous congestion area but not sure its a solid S/R ?
 
For **** sake, I sold at 28 on USDCAD. I had no idea that it fell off, I took after like 30 pips.
 
Cable broken 1h uptrend channel + just hit off the last place where it nosedived 1500 pips...
 
Going short cable very soon!

I'm waiting for a short too Pelzar - it's rejected my descending daily TL and I think we could be in for a retrace back down to at least the 1.44 area where the 38 Fib, Support and the daily 20ema and H4 50 ema are all nestling nicley with each other!!

It seems gbpyen is driving this pair though, so I'd like to see some weakness in usdyen first and this may not appear if the indicies keep powering on ahead?!
Grim
 
Status
Not open for further replies.
Top