Best Thread Potential setups

Status
Not open for further replies.
Any reason why you drew in the pivot there and not higher up, Tom?

I think there are pivots in both places but I think that the longer tails at my area put a little more emphasis on areas of REJECTION - which, in turn, shows they were VALUE areas.

Also, I put a little more emphasis on more recent price action.

Read the chart from RIGHT to LEFT not like the eye which naturally goes from LEFT to RIGHT.
 
Anybody looking at that Pin on Silver hourly?

Not something I have traded before. Chart looks a bit messy but seems to be a good level on 4H & 1H.
 
Anybody looking at that Pin on Silver hourly?

Not something I have traded before. Chart looks a bit messy but seems to be a good level on 4H & 1H.

I don't like the look of it anymore. Not going to trade it.
 
1 hr pin shaping up on GU at 61% fib retrace from 19/11/08 high to yesterdays low. Not sure I like it though as seems to have been a lot of traffic in that area earlier this week.
 
nzdusd

Something to keep an eye on, price has moved away from this level quite strongly on lower timeframe charts.
 

Attachments

  • h4_nzdusd.gif
    h4_nzdusd.gif
    20.5 KB · Views: 256
Last edited:
It's been quiet for me for the last few weeks but something always comes along and when it does it's usually big. PATIENCE.

It's my buzzword.

Beautiful setup.

Absolutely beautiful.

USD/CAD.

Daily double top. Couldn't look better in a book on TA.

Hourly chart shows a great IB setup right at the top.
 
Hi guys,

Unlucky on that Eur/Chf trade :(

I know its hindsight but you have to be careful with these kind of setups and ask yourself before you take them how much room they have to move.

On the surface it looked like a good setup and I was tempted but I passed on it because of this S/R pivot.

It is so interesting to see that this S&R pivot worked straight away when they lowered their interest rates.

Makes you wonder which one was earlier, the egg or the hen:)
 
It's been quiet for me for the last few weeks but something always comes along and when it does it's usually big. PATIENCE.

It's my buzzword.

Beautiful setup.

Absolutely beautiful.

USD/CAD.

Daily double top. Couldn't look better in a book on TA.

Hourly chart shows a great IB setup right at the top.

What was your entry level TD?
 
Well done.

So you are trading double tops straight from the second top until the middle high as a primary tgt?

Makes sense so you can have a tight stop.
 
Hi TD,

Nice trade on loonie. Wish I had spotted it but so far lack the experience to spot these trades. I am active in FF J16 thread and one of the guys there grabbed 450 pips on this one. Just wanted to ask if you used divergence on this one as the Macd showed a clear divergence?

berti


Thats a great trade TD. It must have been very difficult not to have been shaken out during that retrace on Friday evening. I know you have said it over and over about not moving your stop too soon but in this particular trade what gave you the confidence that you would not get stopped out? I guess you would have had a very small stop so that must have helped.

I was watching this one very closely when that double top formed but wasn't too sure about the sideways movement that preceeded the IB so didn't trade it.

Ultimately, a position like this has the potential to go a long way. So it doesn't bother me to give back a few hundred pips.

If you think of it in pips rather than a monetary value it's a lot easier.
 
Scanning For Trades

Hi Guys

Was wondering how often\when you do your scanning? At predetermined times or just as when throughout the day, eg on the hour, 2h, 4h, etc? Reason I ask is that I seem to be missing a lot of good PA setups and would like to know if there is a quick and efficient\optimum way to scan for trades? Any advice very welcome,

thanks,

berti

I use prorealtime with a homebrew indicator/screener. If only I could get access to the automatically generated protrendlines the indicator could rule out more.

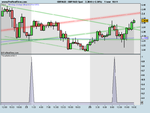
GBP_AUD Spot.png
 
Hi there,

vgrade,

I am using a sreener which is scanning all the available currency pairs for pins and engulfing.
I think it is more useful than having an indicator and show what you can already see.

The code needs some tweeking. It is actually a free available screener from Prorealtime website, but i modified a bit and more importantly renamed it so can't remember what is the name of it on their site:)
I am using IG index SB account for my trades and it is working very well on it as they are using the same charting package for IT-Finance.

I can post the code if you guys are interested.

Viktor
 
Last edited:
REM Body Colors *********************************************************

whiteBody = (Close >= Open)
blackBody = (Open > Close)


REM Body Size (%) *********************************************************

smallBodyMaximum = 0.0025

realBodySize = ABS(Open - Close)

REM Candle Definitions *********************************************************
Doji = ABS(Close - Open ) <= (Close *smallBodyMaximum) OR ABS(Open - Close )<=((High - Low)*0.1)

shootingStar = smallLowerShadow AND NOT doji AND ((blackBody AND ABS(Open -High)>2*realBodySize) OR whiteBody AND ABS( High - Close )>2*realBodySize)

Hammer = smallUpperShadow AND NOT doji AND ((blackBody AND ABS(Close - Low )>2*realBodySize) OR (whiteBody AND ABS( Low - Open )>2*realBodySize))

REM Shadows *********************************************************
smallUpperShadow = (whiteBody AND High <= Close *(1+smallBodyMaximum)) OR (blackBody AND High <= Open *(1+smallBodyMaximum))
smallLowerShadow = (whiteBody AND Low >= Open *(1-smallBodyMaximum)) OR (blackBody AND Low >= Close *(1-smallBodyMaximum))

REM Engulfing **********************************************************
Engulfing = ((blackBody AND (blackbody[1]) AND Close <(Close [1]) AND Open >(Open [1]))) OR ((blackBody AND (whiteBody[1]) AND Open >(Close [1]) AND Close <(Open [1]))) OR ((whitebody AND (whitebody[1]) AND Close >(Close [1]) AND Open <(Open [1]))) OR ((whiteBody AND (blackBody[1])) AND Close >(Open [1]) AND Open <(Close [1]))


SCREENER [(shootingStar and not Hammer and not Engulfing) or (Hammer and not Engulfing and not shootingstar) or (shootingStar and not Hammer and not Engulfing)]


I will modify the screener part to show shooting star, hammer and engulfing for the last two bars instead of just the last one.
 
Ive never seen a chart like that before. What pattern is that? ;)
 
Last edited:
Status
Not open for further replies.
Top