MDunleavy
Member
- Messages
- 89
- Likes
- 3
.Very risky trading idea : EUR/JPY - Buy at 109.20-80; Target: 114.00-60 ; Stop: 108.60.
===============================
EURJPY Outlook
The EURJPY slipped below 109.20 support area yesterday but whipsawed to the upside, topped at
110.42, closed at 110.17 and traded lower earlier today in Asian session around 109.90 at the
time I wrote this comment. Overall we are still in bearish outlook after violation to the
bullish channel but price still trapped in range area between 110.70 – 109.20. We need a
consistent move below 109.20 to continue the bearish pressure testing 108.07 – 107.30 area. On
the upside, break above 110.70 could be a serious threat to the bearish outlook.
(fxinstructor)
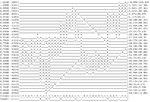
"P&F EURJPY30 Box Size 30X4 or(1.08%) HI/LO
Data 114.724 - 107.306 ~ 2 Month ~ 61.15 Day
Database 2054 records 109.712 (Last Close)
2010-06-18 04~00
2010-08-18 07~30 (GMT+01:00) Paris
BJF Trading Group MDunleavy chart"
114.60|~3O|||________________________________________x_+_______________|0.11%|6.8%
114.30|~6O|||________________________________________x_o_+_____________|0.37%|6.52%
114.00|~9O|||________________________________________x_o_x_+___________|0.63%|6.24%
113.70|~12O||+_______________________________________x_o_x_o_+_________|0.89%|5.96%
113.40|~15O||x_+_____________________________________x_o_x_o___+_______|1.15%|5.68%
113.10|~18O||x_o_+_______________x___x___x___________x_o_x_o_____+_____|1.42%|5.4%
112.80|~21O||x_o___+_____________x_o_x_o_x_o_x___x___x_o_x_o_______+___|1.68%|5.12%
112.50|~24O||x_o_____+_______x___x_o_x_o_x_o_x_o_x_o_x_o_x_o_________+_|1.94%|4.84%
112.20|~27O||x_o_______+_____x_o_x_o_x_o_x_o_x_o_x_o_x_o___o___________|2.2%|4.56%
111.90|~3OO||__o_________+___x_o_x_o___o_x_o_x_o_x_o_x_____o___________|2.46%|4.28%
111.60|~33O||__o___________+_x_o_x_____o___o_+_o_x_o_______o___________|2.72%|4%
111.30|~36O||__o_____________x_o_x_________+___o_x_______+_o___________|2.98%|3.72%
111.00|~39O||__o_____________x_o_x_______+_____o_x_____+___o_____x_____|3.25%|3.44%
110.70|~42O||__o_____x___x___x_o_______+_______o_x___+_____o_x___x_o___|3.51%|3.16%
110.40|~45O||__o_____x_o_x_o_x_______+_________o_x_+_______o_x_o_x_o_x_|3.77%|2.88%
110.10|~48O||__o_____x_o_x_o_x_____+___________o_+_________o_x_o_x_o_x_|4.03%|2.6%
109.80|~51O||__o_____x_o_x_o_x___+_____________+___________o_x_o_x_o_x_|4.29%|2.32%
109.50|~54O||__o_____x_o_x_o___+___________________________o___o___o_x_|4.55%|2.04%
109.20|~57O||__o_____x_o_____+_____________________________________o_+_|4.82%|1.77%
108.90|~6OO||__o_x___x_____+_______________________________________+___|5.08%|1.49%
108.60|~63O||__o_x_o_x___+_____________________________________________|5.34%|1.21%
108.30|~66O||__o_x_o_x_+_______________________________________________|5.6%|0.93%
108.00|~69O||__o_x_o_x_________________________________________________|5.86%|0.65%
107.70|~72O||__o_x_o___________________________________________________|6.12%|0.37%
107.40|~75O||__o_+_____________________________________________________|6.38%|0.09%
107.10|~78O||__+_______________________________________________________|6.65%|-0.19%
Column|~81O||5_2_5_4_1_5_5_4_1_6_8_4_4_5_5_5_4_9_9_4_1_8_6_1_4_4_5_6_4_|
Count|~84O|||__O_____O_______O_______________________O_____5___________|


BJF Trading Group. Excel Chart. Full size attached.
===============================
EURJPY Outlook
The EURJPY slipped below 109.20 support area yesterday but whipsawed to the upside, topped at
110.42, closed at 110.17 and traded lower earlier today in Asian session around 109.90 at the
time I wrote this comment. Overall we are still in bearish outlook after violation to the
bullish channel but price still trapped in range area between 110.70 – 109.20. We need a
consistent move below 109.20 to continue the bearish pressure testing 108.07 – 107.30 area. On
the upside, break above 110.70 could be a serious threat to the bearish outlook.
(fxinstructor)
"P&F EURJPY30 Box Size 30X4 or(1.08%) HI/LO
Data 114.724 - 107.306 ~ 2 Month ~ 61.15 Day
Database 2054 records 109.712 (Last Close)
2010-06-18 04~00
2010-08-18 07~30 (GMT+01:00) Paris
BJF Trading Group MDunleavy chart"
114.60|~3O|||________________________________________x_+_______________|0.11%|6.8%
114.30|~6O|||________________________________________x_o_+_____________|0.37%|6.52%
114.00|~9O|||________________________________________x_o_x_+___________|0.63%|6.24%
113.70|~12O||+_______________________________________x_o_x_o_+_________|0.89%|5.96%
113.40|~15O||x_+_____________________________________x_o_x_o___+_______|1.15%|5.68%
113.10|~18O||x_o_+_______________x___x___x___________x_o_x_o_____+_____|1.42%|5.4%
112.80|~21O||x_o___+_____________x_o_x_o_x_o_x___x___x_o_x_o_______+___|1.68%|5.12%
112.50|~24O||x_o_____+_______x___x_o_x_o_x_o_x_o_x_o_x_o_x_o_________+_|1.94%|4.84%
112.20|~27O||x_o_______+_____x_o_x_o_x_o_x_o_x_o_x_o_x_o___o___________|2.2%|4.56%
111.90|~3OO||__o_________+___x_o_x_o___o_x_o_x_o_x_o_x_____o___________|2.46%|4.28%
111.60|~33O||__o___________+_x_o_x_____o___o_+_o_x_o_______o___________|2.72%|4%
111.30|~36O||__o_____________x_o_x_________+___o_x_______+_o___________|2.98%|3.72%
111.00|~39O||__o_____________x_o_x_______+_____o_x_____+___o_____x_____|3.25%|3.44%
110.70|~42O||__o_____x___x___x_o_______+_______o_x___+_____o_x___x_o___|3.51%|3.16%
110.40|~45O||__o_____x_o_x_o_x_______+_________o_x_+_______o_x_o_x_o_x_|3.77%|2.88%
110.10|~48O||__o_____x_o_x_o_x_____+___________o_+_________o_x_o_x_o_x_|4.03%|2.6%
109.80|~51O||__o_____x_o_x_o_x___+_____________+___________o_x_o_x_o_x_|4.29%|2.32%
109.50|~54O||__o_____x_o_x_o___+___________________________o___o___o_x_|4.55%|2.04%
109.20|~57O||__o_____x_o_____+_____________________________________o_+_|4.82%|1.77%
108.90|~6OO||__o_x___x_____+_______________________________________+___|5.08%|1.49%
108.60|~63O||__o_x_o_x___+_____________________________________________|5.34%|1.21%
108.30|~66O||__o_x_o_x_+_______________________________________________|5.6%|0.93%
108.00|~69O||__o_x_o_x_________________________________________________|5.86%|0.65%
107.70|~72O||__o_x_o___________________________________________________|6.12%|0.37%
107.40|~75O||__o_+_____________________________________________________|6.38%|0.09%
107.10|~78O||__+_______________________________________________________|6.65%|-0.19%
Column|~81O||5_2_5_4_1_5_5_4_1_6_8_4_4_5_5_5_4_9_9_4_1_8_6_1_4_4_5_6_4_|
Count|~84O|||__O_____O_______O_______________________O_____5___________|
BJF Trading Group. Excel Chart. Full size attached.


