Please Help

Lightning McQueen said:
Hi fibonelli

Thats good news but do they allow you to open charts as in darktone's post 4 I would be grateful if you can try this for me.

Im a recent fan of prorealtime so if IG have a similar function they will be on my list also.

Congrats by the way on your 6th place in the share comp, good trading.

cheers

don

HiLMcQ

I still can't open multiple timeframes within 24 hours. You can only open one (daily) chart from the historical research section and only one tick chart for the same instrument.

Thanks for your comments about the comp, I'm using it to practice my trading plan and of testing out different strategies.

regards F
 
fibonelli said:
HiLMcQ

I still can't open multiple timeframes within 24 hours. You can only open one (daily) chart from the historical research section and only one tick chart for the same instrument.

Thanks for your comments about the comp, I'm using it to practice my trading plan and of testing out different strategies.

regards F
Hi fibo

Thanks for checking IG, regarding the comp, me too although I ended up around 50th, so my current strategy stinks, hah I didn't lose any real wedge finding out, thats the good thing about it isn't it, its a good resource, is that right its the last one, typical, I always miss a good party.

cheers

don
 
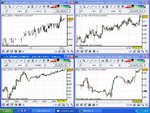
Just thought I would update this thread with the information that IG Index now have multi timeframe charting.....nice! :D

I have an amd 1700xp processor which is probably a little toooooo slooow to run 4 charts, so be warned it would probably stop at running much else on top of this.

Time to upgrade methinks.

-edit-
new screen shot.
I have since tried these charts at several different times and haven't experienced any slowness at all since the first trial of them, and can run other stuff easily while they are running, I am at a loss to explain why this was, perhaps someone with tech savvy could explain?
 

Attachments

  • IGCHARTS.jpg
    IGCHARTS.jpg
    476.3 KB · Views: 198
Last edited:
Lightning McQueen said:
Just thought I would update this thread with the information that IG Index now have multi timeframe charting.....nice! :D

I have an amd 1700xp processor which is probably a little toooooo slooow to run 4 charts, so be warned it would probably stop at running much else on top of this.

Time to upgrade methinks.

Which is the same as Capitalspreads as I mentioned (live platform)
 
Windowsill said:
Which is the same as Capitalspreads as I mentioned (live platform)

Yes, thanks Windowsill for your contribution, I just didn't want to open half a dozen spread bet accounts to see what their charting functions were like. please dont feel you were ignored in anyway, far from it, its all useful info for me and others for the future.

Windowsill said:
Having said that your graphs do look a little different!!

I will probably redo the screenshot, as like those boxes weren't there when i took the shot, I must remember to move the mouse pointer out of the way first :cheesy:

Thanks again

don
 
you can open multiple charts with etrade.
and they are more honest than any other sb company i have used and believe me i have used many now.
plus i am certain their spreads would be lower than cmc's.
although it depends what you trade.
tom
 
Lightning McQueen said:
Yes, thanks Windowsill for your contribution, I just didn't want to open half a dozen spread bet accounts to see what their charting functions were like. please dont feel you were ignored in anyway, far from it, its all useful info for me and others for the future.


I will probably redo the screenshot, as like those boxes weren't there when i took the shot, I must remember to move the mouse pointer out of the way first :cheesy:

Thanks again

don

No not taken. :LOL:

I have looked at IG.......and tinkered with the new graphs......BUT how do you get candlestick graphs!! All I get is the default close line?????

Thanks in anticipation.
 
Windowsill said:
No not taken. :LOL:

I have looked at IG.......and tinkered with the new graphs......BUT how do you get candlestick graphs!! All I get is the default close line?????

Thanks in anticipation.

Thats ok then :)

Regarding candlesticks or any other style you may fancy, with your mouse move the pointer over the price and left click, up will pop a box, left click on "Settings Price", up pops another box. from the "style" drop down menu select "Candlestick" , close the box, there all done, much nicer looking charts.

Hope you can follow that ok

cheers

don
 
Lightning McQueen said:
Thats ok then :)

Regarding candlesticks or any other style you may fancy, with your mouse move the pointer over the price and left click, up will pop a box, left click on "Settings Price", up pops another box. from the "style" drop down menu select "Candlestick" , close the box, there all done, much nicer looking charts.

Hope you can follow that ok

cheers

don

Thanks.

That saved me a few hours!!!

The graph, functions seem to good to be true. I will try the programming if I can get my head around it. At the moment I don't seem to be able to get the intra day example to run on the Dow. :rolleyes:

Have you tried them ???
 
Chailkin Volatility indicator

Hi all,

I've tried to re-work the Chaikin Volatility indicator using ATR instead of hi-low without success :( :eek:

Can anyone help me?

With many thanks

Fibonelli
 
Top