Pinbars etc
Hi Klastica, I have been looking at pinbars and ordinary bullish and bearish bars and starting to develop some theories:
1. Bullish part of a candle is from the close down to the low.
2. Bearish part of a candle is from the high down to the close.
3. Net Bullish/Bearish effect of a candle = Bullish part - Bearish part (I call this the Candle effect of that candle).
4. The strength of the candle effect is proportional to the net candle effect divided by the total candle height.
Using these principles, and selecting candles with strength (rule 4 above) greater than 65% (of the candle height), I downloaded a year of daily EURUSD OHLC data and made the calculations via a spreadsheet. If the candle had a bullish effect of > 65%, I opened a long at high + 5% of candleheight + spread. The aim was to scalp just 90% of the net bullish/bearish effect, then close and take profit. If it had a bearish effect with strength of > 65%, then a short was opened 5% below the low and profit target again was 90% of the net bullish/bearish part. It was tricky calculating losses if stopped out, but I think I got it right in the end. I also ran a second experiment (columns T,U,V in the spreadsheet) where I ignored the 65% minimum rule and played every candle down to 50% (which is an exactly symetrical doji).
The results are staggering and I wonder if they can be replicated in real life. I have been failing trying to get these rules implemented into an autotrading program with GFT because it doesn't do automated OCO orders, and my work-arounds don't seem to be working anything like the spreadsheet. Results:
1: With 65% minimum bullish/bearish effect traded at UKP 1 per point: (starting with Bank of 7000- my current bank)- Net Profit 9276.95, Total Profit 13727.70, Total Losses 4450.75, Maximum drawdown 3.99%, Final balance after 1 year 16276.95
2: No minimum net bearish effect traded at UKP 1 per point: (Starting bank 7000). Net Profit 21388.50, Total Profits 25669.50, Total Losses 6037.75, Maximum drawdown -2.79%, Final Balance after 1 year 28388.50
I will be looking to automate this with the GFT CTL language and hopefully with metatrader also for further testing.
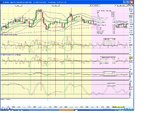
As an aside, it is interesting to look at a plot of the "candle effect" as described above against a candlestick chart. Most times if you are using breakage of trendlines on the candle effect to open and close trades there is a lot of trading and whipsawing. However, I did notice one particular formation on the Candle effect chart that looked like a perfect Head and Shoulders and a trade (short) at that point would have got you into the high of that particular new downtrend, so the H & S on the candle effect (first indicator below the candle chart) predicted the downtrend perfectly. The candle effect is definately a leading indicator.
The other indicator below the candle effect was derived by adding the candle effect to the change in closing price from the previous bar.
Regards, Chris
I can't really work out if your being serious.
I know new people come on here and they look to over simplify trading to make it make more sense (me being one such person). The fact is I have back tested this for 3 months (with oil) using certain rules. The rules involve some less simplistic methods and do involve patience and disipline. The patiance and disipline is were this may all fall down as new traders are not famed for these qualities. I hope not.
Once in each trade I do intend to use S/R, fibs and trends plus other technical analysis to influence my exits (which I believe to be more important than the entries).
The pins will simply act as my reason for entry.
I have read your other threads and I get the impression you feel at times you have created a monster with this pin bar stuff.
Anyway I start on Monday - although not risking to much I will be using real money and all results will be in my journal.

