Pair Trading How Can It Be Done ..

Thanks LII,

One question I have: A charting package allows me to take 2 stocks and draw a chart by either subtracting ones price from the other, or dividing the two stock prices. The result is a line showing the difference between the two stocks. I used this a few years back when I had the bright idea of going long one stock and shorting the other within the same industry using basic TA to decide which was which - very similar to what Nial suggested on the other thread. The chart I described was useful for timing entries as the line of difference (spread) would break out of ranges, take out previous highs etc which was what my entries were based upon; trying to catch a trend in the spread. I made some good money on some trades, mediocre on others. Although not unprofitable, I ditched the strategy as I realised it wasn't really giving me the lower risk I was looking for ( a good paper profit evaporated in to a tiny profit after one of the stocks gapped one morning for the worse). I was trying to emulate a futures spread with stocks (thus the chart). Thats why I'm interested in this thread - to try and put some proper reason to my method.

Would this chart facility still be of value?
(although I appreciate the method of selection and timing probably dont match the true pairs description).

I have attached such a chart that shows what would happen if you were to buy MSFT, short ORCL. You can see where the spread/pair trends. The chart shows a year of data.

Generate chart facility wasnt working.
 

Attachments

  • msftorcl.bmp
    2.4 MB · Views: 99
BBB - A couple of your points seem to bear out what Grey was saying about pairs trading being better for intra-day trading rather than a longer term strategy. As you have obviously found out, the gap movements in stocks at the open can kill this kind of strategy. As regards the charting based on the differential between two stocks - How would you use that to detect stocks to trade ? Or where you suggesting its use would be in tracking the stocks once they had been selected ?
My guess is that it would be better to select stocks on a live basis based on what is happening in the market at any given time rather than having paired certain stocks together in advance. Hopefully it would then be simple task to calculate an ATR (Average True Range) and combine that with the price to work out an exposure on each side of the trade. The key is obviously detecting suitable stocks quickly and making all the calculations quickly enough in order to be able to lay the trades off at the best prices. Tradestation with its powerful "Radar Screen" is ideal for this kind of detection and calculation. I'd be interested to know if anyone has a Radar Screen programmed to detect RSI overbought/oversold in two different time frames ?

Steve.
 
Guys

Just one point .. the reason I mentioned RSI is because nearly all traders know this indicator and have access to it one way or another.. RSI itself is not the key ... The VWAP model does not use RSI to meaure the OB and OS levels .. It uses other methods which ar dead simple and effective.


PS:- Try to distand yourself from the past performance as much as you can . Yesterday;s stock performance is gone , finito, play the market as it unfolds itself in in realtime .. WE choose stocks not based on their history, we choose them based on what is actually happening NOW in the market,,..


Regards
 
Steve:

PreGrey1: I was using the chart facility to find pairs that had a history of trending well together on the 'spread chart'. I looked for a healthy spread between the stocks. I assumed I was minimising risk as the pair had to be within the same sector (correlation). I would take my signal from the spread chart as it broke out of a range, support, resistance, double bottom etc.

PostGrey1: Realised that I didn't really know what I was upto so stopped. I can now see how my selection techniques were flawed, and as you say, I should be looking at ATR and other issues, not historical correlation. My problem was that as an ex derivatives trader, I was trying to match futures strategies with stocks. I now see the errors of my ways and should disregard all my futures spreading knowledge. Useful for futures, but not pairs trading.

As Grey1 rightly points out, the history isn't any guarantee of future performance. I've never met an experienced AND skilled trader who has never pointed this out at one time or another.
 
BBB said:
I used this a few years back when I had the bright idea of going long one stock and shorting the other within the same industry

[...]

Would this chart facility still be of value?

Is what your describing 'spread trading'?

Taking two stocks/indices that historically (sorry Grey1) move together and whenever they diverge; SELL the winner (the one pulling up and away from the lower one) - and BUYthe loser (the lower one).

When (IF!) price history repeats itself and their prices reconverge, you're in profit.
 
Spread trading is a done with futures or options. It cant really be done with stocks/isn't quite the same in my opinion/as I found out, to pairs trading.

The idea of a futures spread is to take opposite sides in order to reduce volatility. You profit as the difference in price between the two components diverges.

Grey1 has 4 ways of defining/choosing PAIRS:
A/Correlation (as in futures, but seems the least favoured in Greys PAIRS)
B/Beta analysis
C/VWAP analysis
D/ Risk/volatility analysis.

I'm trying to rid my brain of futures spread trading. There are similarities, but I will just end up getting confused!
 
BBB,

Spread trading is just another term for pair trading .. If you go to the site below and type in the name of two stocks say AMZN and YHOO you will be given all the info one would need to use correlation analysis for pair or spread trading . How ever as I said you have to hope the history will repeat itself while you are in the trade or else.

http://www.pairtrader.com/index.php
 
Im currently short genz from 56.72, long QCOM from 57.13. making about 12c at this time. using a 20c overall stoploss.
 
That was great to watch Keano.

Looking at the charts, was your entry based on both of them bouncing from the VWAP mpd's?

IanH
 
Actually, no Ian. Intraday pair trading is pretty new to me and was based purely on their relative OB/OS conditions, a little bit of levelII reading (of which I know rather little) and at the point i took the trade i really fancied GENZ as a short play anyway, based on my reading of the 5min chart, which i thought would help the net position of my pair trade.

I dont even have access to the VWAP of stocks at the moment :(.
 
I wonder if someone could post the charts with the VWAP lines on them.
I plot them on esignal, but they are not much good after the event, as they draw horizontal lines & do not keep the history if I refresh the charts.
I know that GENZ had just retraced from the upper MPD line, but think that QCOM was a little bit above the lower one.
It seemed like a good trade to me, but then again, I am only just learning pair trading like you.

Well done Keano.

IanH

p.s. The strategy must have been right. Have you seen them now? +99 on the whole trade!
 
I really really am sorry guys that I can not contribute much because I am downstairs reading your posts from my lap top due to my dodgy water melon look alike foot .. :eek: :eek: :eek:

As soon as I get better I will post the chart of the stocks with their VWAP for those who have no access to VWAP info ..

Good work Keano .. a part from your win, did you feel comfortable with your trade as far as pshycology of the trade was concerned.. ( market direction affecting the trade . )..

was is less worrying ? if this was the case for you then this is what pair trading is all about..
 
Yes Grey. I did find it less worrying. I have had some experience of pair trading before, but not intraday. I have done about 4 pair trades in the last year or so, which lasted about 5 days each, and each trade gave a profit of about 200c so i do have a sort spot for pair trading anyways.

Looking forward to your recovery, so that you can teach us newbies the ins and outs and finer details of intraday pair-trading.

Get well soon

Keano
 
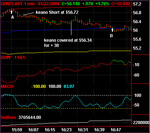
Charts of Keano Trades 1

I have been out most of the day so was not able to help until now, anyway there are a couple of things of interest in the trades made by keano. From a VWAP strategy the Short of GENZ would have been entered at point A ($56.83) and covered at point B ($56.09) for a profit of 72 points. The entry and exit points that keano took are also shown.

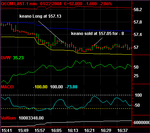
The second trade of QCOM I personally would not have been traded from a VWAP strategy standpoint because the price did not go outside the Lower VWAP band.

I hope this helps


Paul
 

Attachments

  • kgenz.png
    kgenz.png
    9.4 KB · Views: 206
Charts of Keano Trades 2

QCOM Trade by keano
 

Attachments

  • kqcom.png
    kqcom.png
    9.5 KB · Views: 187
Thanks very much for that Paul.
So for that to be a valid trade on your rules, are we looking for the price to go outside the MPD band, & the entry point is as it crosses the line on its way back to the VWAP?

IanH
 
Top