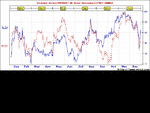
Orange Juice 2005-6

DaveT

Well-known member
Messages
434
Likes
6
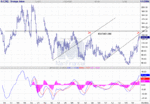
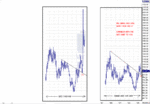
ORANGE JUICE MONTHLY CHART - 1997-2005.

OATS MONTHLY CHART 1980-1988.

I have uncovered a striking similarity between these two monthly chart periods.

The current OJ retest of the (15-year) downtrend line is comparable to the OATS retest in early 1988.

In mid-1988 OATS spiked to record highs due to the big drought that summer in Mid-Western US.

In 2005 we have one of the deadliest hurricane seasons ever in the South/Southeast US.

Can fate lend a hand? Or is it 'all in the charts' anyway?

Or will OJ veer off and do something completely different from here?
 

Attachments

  • oj monthly.GIF
    oj monthly.GIF
    21.3 KB · Views: 503
DaveT said:
ORANGE JUICE MONTHLY CHART - 1997-2005.

OATS MONTHLY CHART 1980-1988.

I have uncovered a striking similarity between these two monthly chart periods.

The current OJ retest of the (15-year) downtrend line is comparable to the OATS retest in early 1988.

In mid-1988 OATS spiked to record highs due to the big drought that summer in Mid-Western US.

In 2005 we have one of the deadliest hurricane seasons ever in the South/Southeast US.

Can fate lend a hand? Or is it 'all in the charts' anyway?

Or will OJ veer off and do something completely different from here?
Hi

Looks interesting but surely you could see these sort of things throughout most of the markets?
 
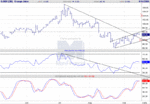
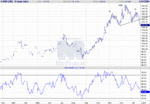
November Orange Juice - buy on correction/dip next week?


1) The downtrend from the July high has been broken. Possible retest next week?

2) Small uptrend channel emerging - support around 9200.

3) Slow Stochastics are overbought - needs to correct back to mid-range.

4) Bollinger bands very tight on intraday (Volatility Squeeze)


Fundamentally, watch the Florida area for more storm/hurricane threats. There are currently two systems just to the south/Carribean which could develop and head for Florida over the next week or so.


I am looking to buy at 9200-9300, (downtrend-line retest).

Target 10400 = Resistance/ Breakout target (of downtrend)
 

Attachments

  • November OJ.GIF
    November OJ.GIF
    20.5 KB · Views: 490
10400 target acheived, before key reversal.
 

Attachments

  • nov OJ.gif
    nov OJ.gif
    24.3 KB · Views: 496
DaveT

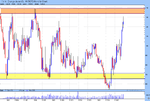
Any thoughts on OJ? Monthly charts attached shows it still has room before we peak at 13800 next major R level.
I am currently holding shorts on the daily from 12600 targetting 12000. Stops currently at 12800.
 

Attachments

  • OJNYM.png
    OJNYM.png
    14.6 KB · Views: 360
  • OJNYD.png
    OJNYD.png
    20.6 KB · Views: 457
Hello smbtnt -

Orange Juice is difficult to call right here, IMO.

The daily chart looks like a Head and Shoulders pattern, but could turn out to be a large consolidation pattern.

Seasonals are ideally BEARISH until late-Feb (on the usual non-occurrance of a Florida Freeze)

On the WEEKLY nearby chart, we have just entered a long-term RESISTANCE ZONE, which has stopped rallies before. Look at the two UPtrend lines, and note how, after being broken, each has become resistance on the next UPSWING, again right in this ZONE.

I would wait to see a sizeable seasonal decline, then re-evaluate basis the long-term charts.

IMHO.
 

Attachments

  • oj weekly.GIF
    oj weekly.GIF
    29.2 KB · Views: 449
  • oj SEAS.gif
    oj SEAS.gif
    10.7 KB · Views: 440
Thanks for the response DaveT, enjoyed theanalysis especially the seasonal cycle, something i have not factored into my entry/exit criteria.
Looks like i have picked the right month for shorts....
 
Thanks to DaveT's seasonal cycle analysis I managed to hold on to my shorts slightly longer than anticipated, covered at 118 and now trailing from 120 from initial short entry of 126.

Cheers DaveT. Any thoughts DaveT?
 

Attachments

  • OJNYD2.png
    OJNYD2.png
    17.7 KB · Views: 440
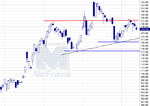
The Head and Shoulders Top on the March has been confirmed, broke down below the next-line and projects to a minumim of 10800.

This is the classic measurement from the top of the Head to the neckline, projected down from the breakout point.

Remains to be seen whether it will meet that, though.

NB - This chart is from yesterday, but mid-session, before it went even lower on the day.
 

Attachments

  • foj march.GIF
    foj march.GIF
    22.8 KB · Views: 321
Got on that one yesterday on the open. Certainly one of those trades that if you don't do, you might as well never trade OJ. Not sure how much downside but certainly yesterday was pretty good. Will await open to decide wheter to increase.
 
Top