Options price charts

kvhutch

Junior member
Messages
35
Likes
0
Options price Charts.

Does anyone know of an online resource (or software provider) that supplies eod option price charts (O,H,L,C - not just tables). I realise that (1) the amount of data for any given security may be vast (2) some options may have long spells when they are not traded. That said, surely someone must provide something along this line? Cheers
 
kvhutch - I've never seen a chart of an option price. The key things to know are the price of the underlying security, which is easy, and the implied volatility. IV charts for options with various times to expiry are available although I'm not sure where you will find them for free. Optionetics provide this as part of their service, although it is not cheap - currently $80 per 4 weeks, or £799 per annum.

http://www.optionetics.com/default.asp

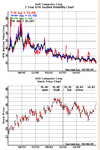
Here's an example of the 2yr IV chart for Dell from Optionetics :-
 

Attachments

  • dell iv.gif
    dell iv.gif
    17.8 KB · Views: 3,110
Thanks Roger. Just that I've recently read Tom DeMarks 'Daytrading with Options' in which he discusses his TD %F indicator (which relies solely on the option price). In discussing the indicator he presented O,H,L,C charts of ATM options. Though it might be available. Thanks again.
 
kvhutch said:
Thanks Roger. Just that I've recently read Tom DeMarks 'Daytrading with Options' in which he discusses his TD %F indicator (which relies solely on the option price). In discussing the indicator he presented O,H,L,C charts of ATM options. Though it might be available. Thanks again.

Whilst this may not be quite what you had in mind, the Hoadley Online calculators are very useful.

http://www.hoadley.net/options/optiongraphs.aspx?

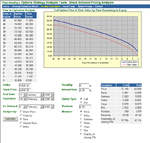
I've attached an example of time value decay for the FTSE 100 Feb 4825 calls.
 

Attachments

  • Hoadley on line calc 110105.gif
    Hoadley on line calc 110105.gif
    29.9 KB · Views: 1,151
Last edited:
kvhutch said:
Does anyone know of an online resource (or software provider) that supplies eod option price charts (O,H,L,C - not just tables). I realise that (1) the amount of data for any given security may be vast (2) some options may have long spells when they are not traded. That said, surely someone must provide something along this line? Cheers

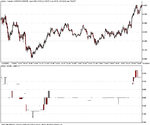
Why not build your own by importing options data into a charting application like AmiBroker (see attachment) ?
 

Attachments

  • QQQAL.PNG
    QQQAL.PNG
    9 KB · Views: 2,232
dewitte said:
Why not build your own by importing options data into a charting application like AmiBroker (see attachment) ?

Why does anyone want a price chart of an option???????
 
Robertral said:
Why does anyone want a price chart of an option???????

I have to ask myself the same question. Since an option price reduces in value over time for any given price in the underlying, a more meaningful chart would be of the impied volatility of the option. These are already available from sites like Ivolatility or Optionetics.
 
RogerM said:
Since an option price reduces in value over time for any given price in the underlying, a more meaningful chart would be of the impied volatility of the option.

However intraday time decay may not play a role and there option price charts could serve some purpose. And perhaps even daily option charts. Which purpose??

Q:
Would it make sense to apply Stochastics to a daily options chart?

A:
a) No, because a daily option chart doesn’t make sense due to time decay
b) No, because Stochastics don’t make sense on any chart

You may answer a) while I will answer b). I mean of course, if something somehow floats your boat …

I use customized RT option bid/ask charts to time entries, AFAIK a feature not provided by any website or software, the latter should certainly not be a criterion.

Regarding Tom DeMarks TD %F however I’d think option charts wouldn’t be very useful because this would require RT scanning of large amounts of options (I myself have never used this very rudimentary indicator and doubt its usefulness).

Rgds,

-dewitte
 
dewitte said:
However intraday time decay may not play a role and there option price charts could serve some purpose. And perhaps even daily option charts. Which purpose??

Q:
Would it make sense to apply Stochastics to a daily options chart?

A:
a) No, because a daily option chart doesn’t make sense due to time decay
b) No, because Stochastics don’t make sense on any chart

You may answer a) while I will answer b). I mean of course, if something somehow floats your boat …

-dewitte

dewitte - Not sure what the question is! :)

Also whilst I agree that stochastics are normally of limited use when used in isolation, they can be VERY useful when combined with other techniques.
 
look......just get a price chart of the implied volatility and the underlying price....an option price chart shows you nothing...........it's a derivative!!!!!!!!!!!!!!!!!!! with an option chart it will contain vol info and IR info along with vol skew info, and please tell me how the hell you are doing to back out various bits of info and apply TA to any option chart as it's a derivative (a function of many stochastic variables)...........
 
Robertral said:
please tell me how the hell you are doing to back out various bits of info and apply TA to any option chart as it's a derivative (a function of many stochastic variables)...........

No TA to an option chart? Why not? If both don't make sense why not stick 'm together? Saves space and keeps the REAL charts clean :LOL:

This is not a TA forum so let's not go into this. Hey it's just a chart, shows you at which price the thing traded. If anything it visualizes the leverage, which is what many of us are in it for, right? But I do agree with the various objections to taking these charts too seriously.

-dewitte
 
please just do yourself a favour and don't trade an option with that kind of thinking.......actually yeah please do trade an option but give me a call and I will gladly trade with you if this if your approach........
 
Robertral said:
give me a call and I will gladly trade with you if this if your approach........

Robertral, my option charts indicate that we're going up so I'd rather give you a put instead of a call ;)
 
dewitte said:
Robertral, my option charts indicate that we're going up so I'd rather give you a put instead of a call ;)

I meant a call as in "phone call" but I I will sell you all the calls you want pal......no joking, this is serious, you shouldn't be doing anything with options charts....as someone else has said, look at the undelryign chart adn the volatility chart...there is lots to look at there.....DONT LOOK AT OPTIONS CHARTS....THEY MEAN NOTHING!!!!!!!!!!!!!!!!!!!!!!!!!!!!!!!!!!!!!!!!!

ok here is one for you...your option chart for a call shows an "up trend"...where do you think the underlying market is going??????
 
Last edited:
Robertral said:
DONT LOOK AT OPTIONS CHARTS....THEY MEAN NOTHING!!!!!!!!!!!!!!!!!!!!!!!!!!!!!!!!!!!!!!!!!

Robertral, I did get your "call" the first time...

I’d share your view that in options charts factors such as time decay and moneyness can provide the inexperienced with a misleading picture, but not the zealotry with which you wage war against ‘m. They mean just as much (or little) as an underlying chart: they link the two data sets on the axes. They are innocent, beautiful and above all, incredibly true, provided you don’t ask more than what they have to give: the price at which the option traded at a certain time.

I know people desperately want underlying charts to give more: support and resistance and flags and pennants and overbought pipe bottoms and oversold pan handles and that’s fine, be happy, but I do feel called to duty when option charts are downgraded to NOTHING!!!!!!!!!!!! simply because they don’t mix with someone’s TA spaghetti, that’s just not fair.

I myself don’t use option charts (the previous post was a joke) but to answer your question: the underlying might be going up as well, unless the option has its own way (increased IV), interest rates explode, or perhaps certain contract adjustments. I’m sure I forget something…

-dewitte
 
Re: Options price Charts.

Does anyone know of an online resource (or software provider) that supplies eod option price charts (O,H,L,C - not just tables). I realise that (1) the amount of data for any given security may be vast (2) some options may have long spells when they are not traded. That said, surely someone must provide something along this line? Cheers
The Online Broker Thinkorswim has charts for all open option contracts. I trade the SPY weekly contract and use the option price charts more for confirming exits. The primary indicator I use is the MACD, and you can add any of the technical studies to the chart, just like a stock price chart. Since I trade directionally, always long positions, the greeks do not have any value for me and the TOS option price charts have become a valuable tool. You can download the TOS platform for a two week trial and see of the software works for what you are doing
 
The best charts I have seen are on livevol, which isn't free but is pretty some great information. TOS charts would be great if their IV's were correct (which they are not).
 
Top