new member alert!

Status
Not open for further replies.
neil

It certainly does look like a DT to me on the daily with rails of negative divergence RSI/MACD etc. I think 1.1530 or so would be a good place to join the party or add to existing positions, ill be stopping the whole position at 1.1560 if it breaks up.


Hello snip

small world! fred says hello btw ;)
 
Last edited:
[14:06 EUR/USD: Retracements, Stops Eyed] Boston, November 4: EUR/USD is running
into some two-way traffic above the 1.1480 level, with the rally stalling out at
1.1486 so far. Dealers are eying the 1.1500 level (38.2% of 1.1620/1.1427) as
well as stops above 1.1510. US equities are creating a slight drag on EUR/USD so
far this morning as S&P futures trade about 3 points below fair value,
indicating a soft opening is expected. Bids are seen at 1.1455 and 1.1430 on
dips. [email protected]/rs

Latest
14:58 GMT November 4] Cable has strung together a half decent recovery having
based in Asia at 1.6675. The move to 1.6775 has been orderly but nonetheless has
eased the oversold condition of the market. The sterling market had clearly over
factored this week"s main event risk. Speculation of a 1/4-point hike, some see
a half, has been a major supporting factor for the pound recently. Cable put on
over five big figures between the middle of October and the end of the month as
the yield card was played. What we are seeing now is a market that has run out
of demand. Throw in some strong U.S data releases into the equation and a sharp
cable pullback was the Monday result. [GBP/USD] fell 220-points last session and
a further 90-points to 1.6675 overnight from where today"s rebound took off
from. Still feel there is more downside risk this session as New York looks to
sell any up-tick. 1.6675-80 overnight low safe but a bear close the risk as the
good start gives way to losses. [EUR/GBP] has been quiet on the main but fresh
demand to 0.6855 is clearly adding to the cable sell. Talk of European names
buying the EUR in the 0.6840"s. [email protected]
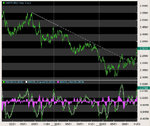
 
Last edited:
I find it very interesting the way we all look at the same information in a different way depending on our time frames and strategy. :cheesy:

I see the DT on eur/usd and the spike reversal on gbp on the daily chart and weekly charts
The hourly charts are showing me a down trend on both now.

My only concern is the continuation of this move down as £/$ has caught up with its up-trend line and showing what could turn out to be a spike on the daily chart. The hourly shows me a pos. inv. H&S but it will need to get above 1.68 for me to close out my shorts... which it looks like its just about to do.

Euro$ is showing a similar DT and i see a asc. tri. with a 4 point target and its 1 point short of this atm. A pull back here is to be expected and hopefully test resistance @ 1.1530 i'd like to see it hold 1.15 though but lets see what happens

For now am still short on both
 
Goober

Thanks mate for the links. It turns out they are both using the same software, anyway I have opted for FX trading station.

Much appreciated... now see how we go..

Cheers Snip
 
Hi
Does anyone here use pivot points for forex. Seen them described as useful on www.tradingsmarts.com but they don't discuss how they are calculated, in particular, at what times to take open/close values. Any ideas or are they of little use anyway?
 
not too keen on them myself depending on your charting software they are calculated for you.

They take the previous days daily data to calculate intraday pivot levels another way of looking at them is they are mathematical support and resistance levels.

You can apply them to any time frame as i know people who use hourly pivots to trade the upcoming hour weekly pivots to trade daily within the week... etc.

I personally like to look at chart patterns and basic support and resistance for forex as it conforms quite nicely to text book TA. Patience and trading those formations your happy with WHEN they appear will give you consistent returns with good money management

HTH
NB
 
Correct me if I am wrong but I think TA support levels etc are easier to see on forex and breakouts etc easily seen and less subject to "fakeouts" - you just need the patience to wait and watch.
The waiting is the hard bit imho.
 
I agree, although recently ive noticed a lot of false BO's usually from the overnight range a quick move outside the range and then a reversal... this is usually prior to 0900 gmt

Yesterday on £/$ was a good example of breaking out but in both directions before tanking in the direction of the first BO... another little quirk maybe? ....watch it and make your own mind up ;)
 
Has anybody noticed the break of long term down trend in GBP/CHF?
Its beyond me to post charts at the moment im afraid if anyone could oblige for now, nice and clear on a 5yr chart.

Id like to able to post charts, so if anyone can give any pointers/links/threads to do with uploading charts(free upload sofware)/codes required to attach to the board etc. That would be great

regards DT
 
This isnt quite how i intended to do it but at least i can show u what i mean :cheesy:
 

Attachments

  • gbp.chf possible breakout 051103.doc
    83 KB · Views: 327
3 yr Chart

only 3year or 10 not 5 - Z
 

Attachments

  • gbch.jpg
    gbch.jpg
    41.9 KB · Views: 310
thx zenda

agree NB, the thread title 'New member alert' doenst really cut it does it :LOL:
 
Status
Not open for further replies.
Top