My Hedged Fund - Another "Trend-Following" Post

- Pyramiding – how do traders add to their investments? There are many ways. One of the variables I use is the basic Standard Deviation / Price, which is of course a volatility play as well.

Boston


Thank you for your comprehensive thread Boston. It makes a nice change from the mass of intraday trading journals.

Would you be kind enough to expand on how you use the basic Standard Deviation / Price in pyramiding please.

Thanks
Jason
 
Thank you for your comprehensive thread Boston. It makes a nice change from the mass of intraday trading journals.

Would you be kind enough to expand on how you use the basic Standard Deviation / Price in pyramiding please.

Thanks
Jason

Thanks for the question and for the good feedback Jason.

Let me first go a little into the “reason” why I use the “Std Dev / Price” (SD/P) variable. As you know, setting a pyramiding decision based on a fixed percentage change threshold could result in buys (same logic would apply to a sell / short decision) not reflective of the underlying “opportunity.”

Example: Suppose assets A and B are both priced at $10. We could set a threshold that signals a pyramiding buy at say, +5%. Here you would purchase a second block at a price of $10.50. Now, A and B may be similar assets, in which case an undiscriminating 5% may work, or they may be significantly different assets (say technology and bonds), with significantly different risks, in which case we should discriminate. In the latter example you would want to consider a volatility measure such as the standard deviation. The bonds’ low volatility may result in a buy signal at, say, $10.20, while the high volatility of the Technology asset could result in the buy signal coming in at $11.00. Considering volatility in this fashion could help in aligning risk amongst different asset types.​
That said Jason, the main technical indicator I use in pyramiding is not the SD/P but the Average True Range (ATR). Here, one would use different ATR multiples, depending on the time-scale of the system; a low ATR multiple (1-2?) for systems of short time-scale (days), higher ATR multiples (10?) for longer systems. I’m in the middle of the road here.

My main use of the SD/P variable is as a secondary metric, part of an algorithm I use in prioritizing entries, exits and pyramiding; I use this algorithm only when faced with multiple signals. This algorithm (also outlined in the “Week 5” post), considers the SD/P, the distance between price and MA’s (the greater the better), and the distance between price and 52-week highs (the smaller the better).

This post may be of interest if you're interested in the math behind the SD/P metric.

Best,


Boston
 
Last edited:
Week 6: Settling in...

Current Positions:

I completed the following transactions this week:

- Sold my positions in Russia (RSX), Taiwan (EWT), South Korea (EWY), Palladium (PALL), Metals & Mining (XME) and Biotech (IBB). These sales were completed in all cases to fund additional purchases in the assets listed below. EWT and EWY would have seen sell signals during the week anyways.
- Sold INDZ (India short) based on technical thresholds late in the week.
- Added to UPRO (S&P 500) and JJG (Grains) after receiving “pyramiding” buy signals.
- Bought UDOW with the INDZ proceeds based on technical signals.​

I am at this point holding "only" 20 positions, the lowest number possible as per the system. This happens only in situations of extended trends, with multiple assets signaling additional purchases. This results in basically selling "the weak" and giving the proceeds to "the strong."

The reader can find all of my current positions in more detail here.

Current performance:

Week 5 was yet again a good week, with the fund increasing in value by 1.89%; total return YTD stands at 9.23%. The investments in leveraged ETF's are paying off, with ERX (up 24%), Financials (up 12%), Midcaps (up 17%) and Nasdaq (up 11%) leading the way. Chart with some relevant benchmarks below:

attachment.php


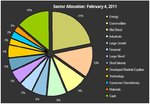
Current sector allocations below:

attachment.php


Comments and questions are always welcomed and often answered...

Boston
 

Attachments

  • week 6.JPG
    week 6.JPG
    34.7 KB · Views: 749
  • week 6-2.JPG
    week 6-2.JPG
    57.1 KB · Views: 729
hi :)

can i ask a easy question - what are the criteria rof an etf being "ok" or "not ok" for the rules

like do they all have to track a calculated index (one that you can know about)?
is it ok if the etf pms can aim for relative returns?
what about liquidity and volume parameters?
 
more questions:

are all your etf investing in stocks?
so no bonds or currency etfs?

I can see commodities in the pie graph but this could just be like miners stuff...

nice blog :)
 
hi :)

can i ask a easy question - what are the criteria rof an etf being "ok" or "not ok" for the rules

like do they all have to track a calculated index (one that you can know about)?
is it ok if the etf pms can aim for relative returns?
what about liquidity and volume parameters?

Let me point you here for the specific ETF's I invest in.

The idea in general is to have an "ETF menu" which considers countries, fixed income, currencies, "Morningstar" segments, SPDR sectors and Commodities. Different times of the year would see me invested in different assets, based of course on trends.

Volume is a tricky one... I aim to trade on ETF's with a minimum volume of 100,000, but that's not always possible. Thirteen of the ETF funds currently listed in the "Menu" trade at less than 100,000 shares per day. Two of my current holdings (grains and the leveraged DOW) fall in this category.

Boston
 
thank you for good answers on that question :)

can you answer the others just as good ::))
 
another question - do you beta weight your allocations?

While the allocations are not beta-weighted, the investment decisions do take into account the beta of the asset, with my goal of being "beta neutral" a distant one as of today (see chart below)" There are just not that many low / negative beta opportunities in the "trending" realm right now.

Boston

attachment.php
 

Attachments

  • week 6-3.JPG
    week 6-3.JPG
    24.8 KB · Views: 682
more questions:

are all your etf investing in stocks?
so no bonds or currency etfs?

I can see commodities in the pie graph but this could just be like miners stuff...

nice blog :)

I do have positions in DBA (Agriculture), Grains (JJG) and Water (PHO)... see the entire position list here.

Boston
 
I do have positions in DBA (Agriculture), Grains (JJG) and Water (PHO)... see the entire position list here.

Boston

hi sorry i read it now but there must be rules for instruments that you CANT trade in...

?
I mean you must have a universe of instruments that you can allocate your assets to - whats the list?
 
hi sorry i read it now but there must be rules for instruments that you CANT trade in...

?
I mean you must have a universe of instruments that you can allocate your assets to - whats the list?

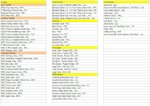
They are listed in a format you can copy here. Some may not be classified correctly (e.g. Real Estate), but this is the list.

attachment.php
 

Attachments

  • week 6-4.JPG
    week 6-4.JPG
    117.4 KB · Views: 579
Blimey, that's an extensive list .... how do you keep on top of all of this? I stick to ten markets "only".
 
Blimey, that's an extensive list .... how do you keep on top of all of this? I stick to ten markets "only".

Meanreversion,

I simply export the data into my computer at the end of the day, followed by a visual review of the indicators, scanning for buy / sell signals in this way. The actual task does not take more than 10-15 minutes; remember, fundamentals do not play a role here, just system outputs. For me, the difference between tracking 10 or 100 assets is minimal at best.

Risk management tactics take a bit longer, but I would say that I manage the entire process in no more than 60-90 minutes per day.

How do you determine your investment decision? Are you a TF yourself?

Boston
 
One of my systems is a mechanical trend model which I use on FX, commodity and interest rate futures. In theory I'd happily trade 20 markets, but where I would come unstuck is in the logistics of entering and handling orders. In addition, I simply don't have the capital to trade this many markets.
 
Boston, just looking at your blog, would you say $10k is an average investment size for you, per ETF?

Investment size today would be $7,541 to be exact. I allocate investments using 2.5% of available capital; current proprietary capital in "My Hedged Fund" is $229,363, plus the use of $72,267 in marginable securities give me a total of $301,630 of available capital, times 2.5%, and there's your $7,541. This number of course fluctuates on a daily basis.

Boston
 
Week 7: When will the trend end?


Bears are saying we're definitely over-extended, and that a correction is imminent, some bulls say this ride has barely started. While I may care about the answer, and as a true trend-follower would say, I do not have the slightest clue.

Current Positions:

I completed the following transactions this week:

  • - Sold my positions in Grains (JJG), Nuclear Energy (NLR) and 30-Yr Treasuries Short (TMV)
  • - Reduced my positions in Financial Services (FAS) and Agriculture (DBA).
  • - Added to Nasdaq (TQQQ), Japan (EWJ), Canada (EWC) and the S&P 500 (UPRO) after receiving “pyramiding” buy signals.
  • - Bought the Russell 2000 (TNA), Real Estate (IYR) and Metals & Mining (XME) after receiving technical buy signals.

I continue to hold 20 positions, as well as some cash which I may use to add to my Consumer Discretionary (XLY), Water (PHO) and Materials (XLB) positions early next week.

Current positions listed in more details here.

Current performance:
Week 7 saw a continuation of the trends observed throughout the entire year; following in general the rise in the US, Canada and Japan markets, as well as the Energy Sector. I am at this point (and have been for almost two weeks) totally out of the emerging markets arena.

The fund increased in value by 3.02% during the week; total return YTD stands at 12.53%. Chart with some relevant benchmarks below:

attachment.php


Current sector allocations below:

attachment.php


Questions and comments always welcomed and often answered...

Boston
 
Top