Martin Kay
Well-known member
- Messages
- 429
- Likes
- 0
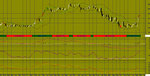
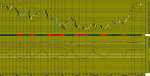
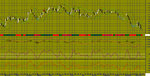
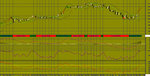
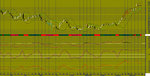
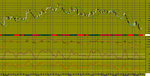
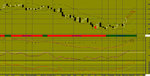
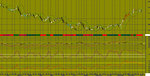
Weekly US Dollar / Japanese Yen-USDJPY As of 02/12/16
A white body has formed as prices closed higher than open.
The previous 10 candlestick bars, there are 8 white candles versus 2 black candles with a net of 6 white candles.
The previous 50 candlestick bars, there are 27 white candles versus 23 black candles with a net of 4 white candles.
Three white candles has formed during the last three bars. Although these candles were not big enough to create three white soldiers, the steady upward pattern is bullish.MACD is BULLISH as the MACD is above the signal line.
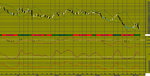
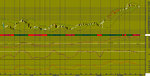
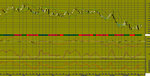
The MACD crossed above the signal line 14 week(s) ago. Since the MACD crossed the MACD moving average, US Dollar / Japanese Yen's price has increased 11.47%, and has been fluctuating from a high of 114.823 to a low of 99.941.
The MACD is currently not in an Overbought/Oversold range.
There have been no divergence signals during the last 5 periods.
The Stochastic Oscillator is currently above 80. This is an indication of the security being in an "overbought" condition. No Stochastic Buy or Sell signals generated today. The last signal was a Buy 28 Week(s) Ago.
The RSI is not currently in a topping (above 70) or bottoming (below 30) range. A buy or sell signal generated when the RSI moves out of an overbought/oversold area. The last signal was a Buy 20 week(s) ago.
The RSI has just reached its highest value in the last 14 week(s). This is BULLISH signal.
Currently, the Momentum Oscillator is in an overbought condition.
The last Directional Movement Indicators (DMI) signal was a BUY 2 week(s) ago.
There were no SAR signals generated today. The last SAR signal was a Buy 5 week(s) Ago.
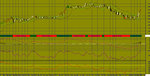
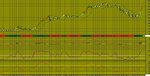
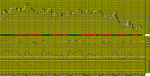
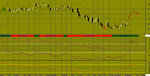
The close is currently
ABOVE its 200 weekly moving average
ABOVE its 50 weekly moving average
ABOVE its 20 weekly moving average
The current market condition for US Dollar / Japanese Yen is Very Bullish
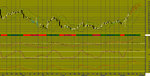
US Dollar / Japanese Yen closed above the upper Bollinger Band by 10.3%. Although prices have broken the upper Bollinger Band and an upside breakout is possible, the most likely scenario is for the current trading range that US Dollar / Japanese Yen is in to continue. Bollinger Bands are 45.10% wider than normal.
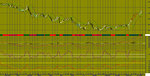
A white body has formed as prices closed higher than open.
The previous 10 candlestick bars, there are 8 white candles versus 2 black candles with a net of 6 white candles.
The previous 50 candlestick bars, there are 27 white candles versus 23 black candles with a net of 4 white candles.
Three white candles has formed during the last three bars. Although these candles were not big enough to create three white soldiers, the steady upward pattern is bullish.MACD is BULLISH as the MACD is above the signal line.
The MACD crossed above the signal line 14 week(s) ago. Since the MACD crossed the MACD moving average, US Dollar / Japanese Yen's price has increased 11.47%, and has been fluctuating from a high of 114.823 to a low of 99.941.
The MACD is currently not in an Overbought/Oversold range.
There have been no divergence signals during the last 5 periods.
The Stochastic Oscillator is currently above 80. This is an indication of the security being in an "overbought" condition. No Stochastic Buy or Sell signals generated today. The last signal was a Buy 28 Week(s) Ago.
The RSI is not currently in a topping (above 70) or bottoming (below 30) range. A buy or sell signal generated when the RSI moves out of an overbought/oversold area. The last signal was a Buy 20 week(s) ago.
The RSI has just reached its highest value in the last 14 week(s). This is BULLISH signal.
Currently, the Momentum Oscillator is in an overbought condition.
The last Directional Movement Indicators (DMI) signal was a BUY 2 week(s) ago.
There were no SAR signals generated today. The last SAR signal was a Buy 5 week(s) Ago.
The close is currently
ABOVE its 200 weekly moving average
ABOVE its 50 weekly moving average
ABOVE its 20 weekly moving average
The current market condition for US Dollar / Japanese Yen is Very Bullish
US Dollar / Japanese Yen closed above the upper Bollinger Band by 10.3%. Although prices have broken the upper Bollinger Band and an upside breakout is possible, the most likely scenario is for the current trading range that US Dollar / Japanese Yen is in to continue. Bollinger Bands are 45.10% wider than normal.