Martin Kay
Well-known member
- Messages
- 429
- Likes
- 0
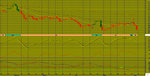
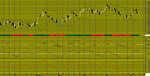
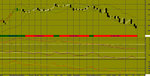
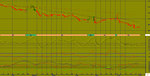
Daily US Dollar / Japanese Yen-USDJPY As of 03/06/16
*** Intra-Daily Trading Strategy: SELL US Dollar / Japanese Yen
Sell Target: 105.6310
Enter New SELL on OPEN and exit SELL positions at Target price or at Stop price.
(NOTE: Adjust Stop Loss Price according to your trading risk.)
Do not reverse after exiting. This is a recommendation for INTRA-DAY TRADING only!!!!!
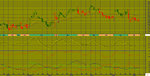
A big bearish black candle has formed. Prices closed considerably lower than open. If the candle appears when prices are "high," it may be the first sign of a top. If it occurs when prices are confronting an overhead resistance area, a moving average, trend line, or price resistance level, the long black candle adds credibility to the resistance. Likewise, if the candle appears as prices break below a support area, the long black candle confirms the failure of the support area.
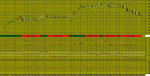
The previous 10 candlestick bars, there are 4 white candles versus 6 black candles with a net of 2 black candles.
The previous 50 candlestick bars, there are 23 white candles versus 27 black candles with a net of 4 black candles.
Three black candles has formed during the last three bars. Although these candles were not big enough to create three black crows, the steady downward pattern is bearish.MACD is BEARISH as the MACD is below the signal line.
The MACD crossed below the signal line 0 day(s) ago. Since the MACD crossed the MACD moving average, US Dollar / Japanese Yen's price has been unchanged, and has been fluctuating from a high of 109.133 to a low of 106.501.
The MACD is currently not in an Overbought/Oversold range.
There have been no divergence signals during the last 5 periods.
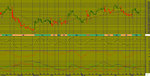
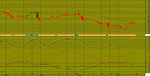
The Stochastic Oscillator is currently below 20. This is an indication of the security being in an "oversold" condition. No Stochastic Buy or Sell signals generated today. The last signal was a Sell 4 Day(s) Ago.
The RSI is not currently in a topping (above 70) or bottoming (below 30) range. A buy or sell signal generated when the RSI moves out of an overbought/oversold area. The last signal was a Buy 38 day(s) ago.
The RSI has just reached its lowest value in the last 14 day(s). This is BEARISH signal.
Currently, the Momentum Oscillator does not show an overbought or oversold condition.
The ADX is currently below both Plus and Minus Directional indicators. This should not use to initiate any trades right now.
The Directional Movement Indicators (DMI) currently is not indicating a specific price direction. Because this is a trend following system, it should not use to initiate any trades right now. The last Directional Movement Indicators (DMI) signal was a SELL 26 day(s) ago.
There were no SAR signals generated today. The last SAR signal was a Sell 2 day(s) ago.
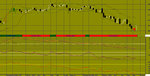
The close is currently
BELOW its 200 daily moving average
BELOW its 50 daily moving average
BELOW its 20 daily moving average
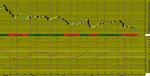
The current market condition for US Dollar / Japanese Yen is Very Bearish
US Dollar / Japanese Yen closed below the lower Bollinger Band by 23.8%. Bollinger Bands are 15.41% narrower than normal. The current width of the Bollinger Bands (alone) does not suggest anything conclusive about the future volatility or movement of prices.
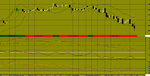
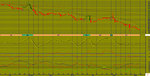
*** Intra-Daily Trading Strategy: SELL US Dollar / Japanese Yen
Sell Target: 105.6310
Enter New SELL on OPEN and exit SELL positions at Target price or at Stop price.
(NOTE: Adjust Stop Loss Price according to your trading risk.)
Do not reverse after exiting. This is a recommendation for INTRA-DAY TRADING only!!!!!
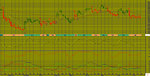
A big bearish black candle has formed. Prices closed considerably lower than open. If the candle appears when prices are "high," it may be the first sign of a top. If it occurs when prices are confronting an overhead resistance area, a moving average, trend line, or price resistance level, the long black candle adds credibility to the resistance. Likewise, if the candle appears as prices break below a support area, the long black candle confirms the failure of the support area.
The previous 10 candlestick bars, there are 4 white candles versus 6 black candles with a net of 2 black candles.
The previous 50 candlestick bars, there are 23 white candles versus 27 black candles with a net of 4 black candles.
Three black candles has formed during the last three bars. Although these candles were not big enough to create three black crows, the steady downward pattern is bearish.MACD is BEARISH as the MACD is below the signal line.
The MACD crossed below the signal line 0 day(s) ago. Since the MACD crossed the MACD moving average, US Dollar / Japanese Yen's price has been unchanged, and has been fluctuating from a high of 109.133 to a low of 106.501.
The MACD is currently not in an Overbought/Oversold range.
There have been no divergence signals during the last 5 periods.
The Stochastic Oscillator is currently below 20. This is an indication of the security being in an "oversold" condition. No Stochastic Buy or Sell signals generated today. The last signal was a Sell 4 Day(s) Ago.
The RSI is not currently in a topping (above 70) or bottoming (below 30) range. A buy or sell signal generated when the RSI moves out of an overbought/oversold area. The last signal was a Buy 38 day(s) ago.
The RSI has just reached its lowest value in the last 14 day(s). This is BEARISH signal.
Currently, the Momentum Oscillator does not show an overbought or oversold condition.
The ADX is currently below both Plus and Minus Directional indicators. This should not use to initiate any trades right now.
The Directional Movement Indicators (DMI) currently is not indicating a specific price direction. Because this is a trend following system, it should not use to initiate any trades right now. The last Directional Movement Indicators (DMI) signal was a SELL 26 day(s) ago.
There were no SAR signals generated today. The last SAR signal was a Sell 2 day(s) ago.
The close is currently
BELOW its 200 daily moving average
BELOW its 50 daily moving average
BELOW its 20 daily moving average
The current market condition for US Dollar / Japanese Yen is Very Bearish
US Dollar / Japanese Yen closed below the lower Bollinger Band by 23.8%. Bollinger Bands are 15.41% narrower than normal. The current width of the Bollinger Bands (alone) does not suggest anything conclusive about the future volatility or movement of prices.