Making Money Trading

Which market do you want to learn to trade?


  • Total voters
    101
  • Poll closed .
Status
Not open for further replies.
update

Vince, you still with us? How are the markets treating you?

Hiya T_D,

Yeah, still keeping a keen (if infrequent!) eye on proceedings.

Certainly, this thread has really began to generate momentum again in the last fortnight; it's great to see the guys who started as rookies using this "PB + pivots + fibs" approach grow as traders (I'm looking at you Grim & Ljr in particular !!!)

As for me, I'm actually testing out some of the trading physchology pointers that are littered through this thread over with our betting exchange friends on Betfair.

I'm not looking to back high/lay low to achieve a risk-free arb; moreover, it's the concept of have a "high-probability edge" - and it's application - coupled with money-management; an avoidance of over-betting/laying & the drawing down of any excess profits (over and above my "working capital" balance) each evening.

It's what works for me (currently!), so I tentatively suggest I've found my own version of the "Holy Grail".

It's going very well so far, so far the time being, I'm merely an interested (and non-trading) viewer of this thread.

However, the high level of trading advice gems that have been posted in the last 10/15 pages was a pleasant surprise.

Keep up the good work all & best wishes with your trading.

Good Luck,
VS
 
Mr Gecko,

I can't dispute what you say. That will teach me not to go beyond the context, I suppose. I'll just sit here in the corner and shut up.

As you were.

Good Trading,

Grant.
 
Mr Gecko,

I can't dispute what you say. That will teach me not to go beyond the context, I suppose. I'll just sit here in the corner and shut up.

As you were.

Good Trading,

Grant.

ermm... i didn't mean to upset anyone :eek: did I go too far?

and in all fairness Grant your point is a good one; an entry like the example i posted does mean you miss out on alot of the move, and with aggressive stops below the major support it stings if you get it wrong. It was not intended as an improvement on the pin entry you described, but as an alternative.

but this is all swings and roundabouts really; the exact conditions of the entry is trivial in comparison with finding the move in the first place.
 
Usdcad

I am glad to have found this thread, one that discusses price action, price bar interpretation and fib levels.
USDCAD chart - Yellow zone is support and orange zone is potential pullback entry for longs if confirmed by reversal price bars.
EURUSD - orange zone potentail reversal zone - will wait for candle reversal for confirmation.

Any thoughts welcome.
 

Attachments

  • usdcad.png
    usdcad.png
    28.1 KB · Views: 351
  • eurusd.png
    eurusd.png
    22.3 KB · Views: 327
Mr Gecko,

I don't think it's a question of right or wrong.

My point illustrates what I consider significant and on very short time-frames. The longer the time-frame, the greater the stop but this is not to say that the longer time-frame is wrong; plenty make money out of 1, 5-day or even monthly but for me personally, I would be afeared with anything more than 1-minute.

Grant.
 
TBH Grant, my entry would be higher still.

When I say "enter on break of high", what I really mean is "place a buy stop above the high of the bar that closes above the high of the pin bar".

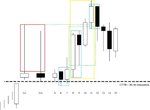
In the attached example, I've quickly sketched out what I mean (it's an over-simplified example, but it gets the point across).

Here we see a SETUP SIGNAL - a test of multiple support levels. I like to see price dip below support but never close below it. In this case we have a typical 2xLHC...

...Immediately followed by a TRIGGER BAR that closes above the high of our SETUP pattern; the market is comfortable with prices closing above our support, and it appears a new trend is being started...

... giving us our ENTRY BAR; a buy stop just above the prior high; we are seeing higher highs and higher lows; Three white soldiers; sell stop is placed discretionally, but never below the low of our SETUP pattern (e.g. low of TRIGGER BAR to be conservative).

Obviously there are a load of other conditions that make this a no-go *like where in the hell the bloody thing happens in the first place!!!!*, but thats the gist of my entry conditions. What we are trying to capture is the part of a trend where price is moving with the greatest velocity (without relying on stochastics etc...), which is why we leave it for so long.

OK there isnt a pin bar in sight, but there is more than one way to skin the Price Action cat.

Also, I feel I should mention that there are other traders who do the exact opposite; they may try to enter on a fib retracement level of their setup signal, or split their setup signal into multiple bars of a lower timeframe and enter on the low of the most recent, and so on... and some of them do very well out of it, with better entry and smaller risk. This is just my approach, swimming with the tide.

hi yawl,can you tell me where your gettin the images your posting from?looks like something i would like to read :eek::cheesy:
 
I am glad to have found this thread, one that discusses price action, price bar interpretation and fib levels.
USDCAD chart - Yellow zone is support and orange zone is potential pullback entry for longs if confirmed by reversal price bars.
EURUSD - orange zone potentail reversal zone - will wait for candle reversal for confirmation.

Any thoughts welcome.

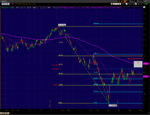
see attached chart of USD/CAD 2 yr daily. If we agree that there may be support at the .97 ish levels (where the .23 and .38 levels are), and assign this as our risk, i think this trade is left wanting w.r.t rewards.

I wouldn't worry too much about resistance where the .32 and .68 fib levels are, price has traded through them too many times.

but resistance 2 at 1.033 (the dashed blue line) with further, and i think heavy, resistance 3 where the .50 , .78 and 365ema are clustered together. I just can't see that there's going to be a big move without struggling at R's 2 and 3 first.

Add into the mixer the issue of USD/CAD parity holding/not holding, I'd watch for a little longer, eying either a break of the support level identified or the heavy resistance near the 365 ema.
 

Attachments

  • 2008-04-04-TOS_CHARTS.png
    2008-04-04-TOS_CHARTS.png
    42.3 KB · Views: 338
I drew them especially :smart:

ok,thanks.
been lookin for a decent book on candles book the interesting ones seem well over priced for me.thanks for your quik response.
goin to the real ,job good luck yawl
 
Hi guys,

Is the last 4h bar on the eur/usd a PB. It's off the 1.57 ppz. Would any of you consider shorting.... again?

Thanks
 
see attached chart of USD/CAD 2 yr daily. If we agree that there may be support at the .97 ish levels (where the .23 and .38 levels are), and assign this as our risk, i think this trade is left wanting w.r.t rewards.

I wouldn't worry too much about resistance where the .32 and .68 fib levels are, price has traded through them too many times.

but resistance 2 at 1.033 (the dashed blue line) with further, and i think heavy, resistance 3 where the .50 , .78 and 365ema are clustered together. I just can't see that there's going to be a big move without struggling at R's 2 and 3 first.

Add into the mixer the issue of USD/CAD parity holding/not holding, I'd watch for a little longer, eying either a break of the support level identified or the heavy resistance near the 365 ema.

Thanks for your reply Mr G,
However, if she does move to 1.033 or 1.0450 then we still have 300 pips to cover. So why would this trade be left wanting? I am not with you.
Please elaborate.
Unless ofcourse you are looking at entry on weekly bar breakouts.

cheers.

ps: candlebar piccies very interesting - can we have more please....
 
Last edited:
Is this a PB? USDCHF (yesterday)

Is this right? The PB almost touches the 38... I entered last night when the next bar's price broke below, and made about 25 pips.
 

Attachments

  • pb.JPG
    pb.JPG
    193.1 KB · Views: 321
Thanks for your reply Mr G,
However, if she does move to 1.033 or 1.0450 then we still have 300 pips to cover. So why would this trade be left wanting? I am not with you.
Please elaborate.
Unless ofcourse you are looking at entry on weekly bar breakouts.

Recently we've seen price move back and forth between support @ .9750 (ish) and resistance @ 1.033 - it looks like a pretty stable flag pattern. The trouble I have with picking an entry now (either long or short) is that we are slap bang in the middle of it; the trade would'nt be made with price moving off support or resistance, but rather towards it. A long or short trade now would have an R:R of 1:1 as we are approx equidistant from the .9750 and 1.033 levels we're keeping an eye on.

an R:R of 1:1 isn't so much of a problem, its that we're at a point where we don't have enough information to tip the odds of picking the right direction in our favour (because we're not moving off any S/R levels).

IIRC you mentioned going long on a pullback; my *largely qualitative* view is that we have two resistance levels looming close above our heads, which will take some steam out of our long momentum (even if its only temporarily). And with no additional supporting long factors to help us out until .9056, and a glance at the weekly chart, it seems to me that the Sum of the "short" factors is greater than the sum of the "long" factors; this is what i mean when I say the trade - currently - is left wanting.

All of this is assuming stops and targets are placed at existing support and resistance. I rather think the way to play this pair will be;

Support @ .9750 fails to break and we trade the flag ranging pattern (long)

Support @ .9750 breaks and we trade the trend (short)

Resistance @ 1.033 fails to break and we trade the flag ranging pattern (short)

Resistance @ 1.033 breaks and we wait to see a test of the 365ema (wait and see).

right now I'd stay flat from the dailies; I want to trade it as it moves off S/R, which means I'll have to wait until it gets there (whichever one it moves to) first. It might take a couple of weeks before anything pops up.
 
leaving this over the weekend, did not like the way she reacted at 5700, moved stop to 5753.

present resistance coming up at 5761, 5764, 5774 and 5786

reversed off support at the 23 fib, with a spike down to support one day ago

mp
 
ok,thanks.
been lookin for a decent book on candles book the interesting ones seem well over priced for me.thanks for your quik response.
goin to the real ,job good luck yawl

try this

Japanese Candlesticks Charting - Technical Analysis

IQ Chart - Real-Time Technical Stock Charts

Technical Indicators and Overlays - StockCharts.com

Flags and Pennants

Candlesticks and Support - StockCharts.com

IQ Chart - Real-Time Technical Stock Charts

thats enough for one day !

MP
 
Last edited:
a rant

ps: candlebar piccies very interesting - can we have more please....

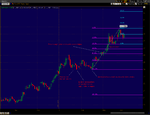
Please look at the attached docs. They should all make sense if you read them all.

The candlestick patterns I've shown so far are well publicised. There are perhaps half a dozen patterns that, if understood and utilised, can be engineered to provide multiple entry and exit signals to suit different trade environments and different traders.

Candlestick alchemy, I recommend it.

But to be frank, IMO the use of candlesticks just to fine tune entries and exits is a total waste of their potential. I absolutely believe that they are suited to this, and have applications across most aspects of trading, but there's more to them than that (see docs).

As an aside, I appreciate that the vast majority of posters on this thread are solely concerned with Trader_Dante's pin bar setups - and so far none of my posts have contributed to pin bars or their uses. However, it has been my intention to make new traders aware that pin bars aren't the only way to trade price action. Yes, of course they are a formidable tool to have in your "toobox". Infact they are probably one of the sharpest tools of applied PA available. But there is a whole bunch more to them also; there are plenty of good trades that dont have a pin bar anywhere near them, but are founded on entirely the same principals.
 

Attachments

  • EUR_GBP_commentary.doc
    36.5 KB · Views: 571
  • EUR_GBP_2yrDaily.png
    EUR_GBP_2yrDaily.png
    28.2 KB · Views: 567
  • EUR_GBP_daily.jpg
    EUR_GBP_daily.jpg
    18.4 KB · Views: 554
Mr Gecko,

Can you (or anyone) recommend any books regarding analysis of the basic bar chart? Can't see much in the Bookstore.

Grant.
 
Mr Gecko,

Can you (or anyone) recommend any books regarding analysis of the basic bar chart? Can't see much in the Bookstore.

Grant.
Might be too obvious, but have you read Technical Analysis of the Financial Markets, by John Murphy?
 
Status
Not open for further replies.
Top