You are using an out of date browser. It may not display this or other websites correctly.
You should upgrade or use an alternative browser.
You should upgrade or use an alternative browser.
Making Money Trading
- Thread starter trader_dante
- Start date
- Watchers 334
- Status
- Not open for further replies.
trader_dante
Veteren member
- Messages
- 4,535
- Likes
- 1,704
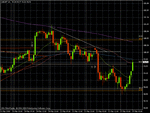
good pin bar setup here on the usd/jpy
I wouldn't play that jonj. I see no significant s/r pivot and no confluence.
barjon
Legendary member
- Messages
- 10,752
- Likes
- 1,863
Hi TD,
I watched the pin you refer to come and go and I did nothing; I can't seem to take action. I had all the fibs. trends and s/r in place for ages.
It's been the same with other daily candle chart opportunities. They just seem to slowly slide away. I keep analysing, It's as if they move so slowly, I can't see them.
I'm a starving cheetah just watching the prey wander into view and then slowly ambling off into the distance.
Maybe I've been doing 5min charts for too long.
Have you ever experienced anything like this?
Best Regards,
Neil
neil
'scuse me for butting in 🙂
Did your rules say "go" but you couldn't bring yourself to press the button? I went through a period like that when I first started dropping to a lower time frame to "fine-tune" my entries - didn't fine-tune them at all, just kept finding reasons "why not" until it was too late. So I reverted to just sticking an order in at the trigger level for a time.
good trading
jon
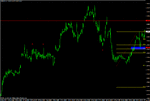
I wouldn't play that jonj. I see no significant s/r pivot and no confluence.
yellow line =daily fib from 26/2 to 17/3
white line =4 hourly 11/2 to 17/3
blue linea are the possible hourly channel lines
do you not find this??or am i missin somethin??
Attachments
hi there td,glad to have you online.
iv been readin your thread surely but slowly and iv learned a lot,not just about pin bars,thanks alot.
but from the little iv researched them i dont see too many. either one must watch 10,000 instruments or you need other methods to trade ??
i look for consolodation breaks (only tradin on demos) i would appreciate your view on my chart.
Attachments
hi there td,glad to have you online.
iv been readin your thread surely but slowly and iv learned a lot,not just about pin bars,thanks alot.
but from the little iv researched them i dont see too many. either one must watch 10,000 instruments or you need other methods to trade ??
i look for consolodation breaks (only tradin on demos) i would appreciate your view on my chart.
wrong chart,sos
Attachments
trader_dante
Veteren member
- Messages
- 4,535
- Likes
- 1,704
Not suggesting that I am in any way as experienced as Steve Nison (the father of candlestick analysis) but just received an email that invites you to one of his seminars for the princely sum of $900.
Here is some of the text from the email:
You know how important I think Support and Resistance is to your trading.
When you can properly identify S&R levels on your charts, your odds for success will skyrocket.
And when you combine Support and Resistance with candles for confirmation, you'll eliminate guessing from your trading.
That's because you'll know whether a trend is continuing or if it's reversing.
The most exciting charting development I've seen in a long time is 'Pivot Points.'
...I can show you how to use candles to confirm these levels.
Together, Pivots and candles can be an unstoppable profit machine for you.
🙂
Sound familiar?
trader_dante
Veteren member
- Messages
- 4,535
- Likes
- 1,704
yellow line =daily fib from 26/2 to 17/3
white line =4 hourly 11/2 to 17/3
blue linea are the possible hourly channel lines
do you not find this??or am i missin somethin??
jonj,
I believe you're using the fibs in the wrong way.
You're drawing your fibs from the swing high to the swing low on the daily and 4hr TF. This measures the retracement levels on the way UP and shows where the market could potentially turn down again.
If you want to use fibs as a support (as you do in this case) then you need to measure from the recent swing LOWS to the swing HIGHS.
Tom
trader_dante
Veteren member
- Messages
- 4,535
- Likes
- 1,704
mornin yawl,hi TD,sound advice from your last post.luckily im not trading real money!looked good for a candle.
would you have traded the next one (wich actually hit the fib lines i have)?
Hello again jonj,
No, I wouldn't have taken the second one either. The second pin hits a support level but there is no PIVOT there.
That doesn't mean you shouldn't try these things (especially on demo). I am very particular in my trades.
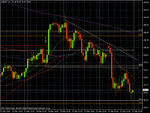
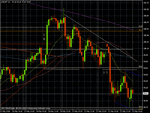
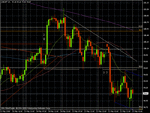
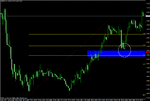
This is the last trade I made which was yesterday afternoon:
Chart 1 shows that the market trades into an hourly pivot AND the 50 fib of the last major swing low. This means there is TWO strong supporting factors (highlighted by the blue rectangle)
Chart 2 is a close up.
I only took 52 ticks as I really wanted to leave the office and as a result was looking for a reason to get out of this trade but played by the rules I have outlined in this thread it would still be open.
Attachments
Last edited:
trader_dante
Veteren member
- Messages
- 4,535
- Likes
- 1,704
hi there td,glad to have you online.
iv been readin your thread surely but slowly and iv learned a lot,not just about pin bars,thanks alot.
but from the little iv researched them i dont see too many. either one must watch 10,000 instruments or you need other methods to trade ??
i look for consolodation breaks (only tradin on demos) i would appreciate your view on my chart.
Jonj,
Thought I would answer this one in a new message. As I've said before, I use many other methods to trade but pin bars are easy to teach, easy to find, easy to trade and very, very profitable so I concentrate on them here!
I've heard other people say they don't find too many opportunities. I usually find one or two very good ones per week and that is really all you need to make incredible money in this game.
I am still surprised by how many traders think that the more they trade the more money they are going to make.
For most traders the EXACT OPPOSITE is true.
jonj,
I believe you're using the fibs in the wrong way.
You're drawing your fibs from the swing high to the swing low on the daily and 4hr TF. This measures the retracement levels on the way UP and shows where the market could potentially turn down again.
If you want to use fibs as a support (as you do in this case) then you need to measure from the recent swing LOWS to the swing HIGHS.
Tom
TD,many thanks for pointing that out,i allways treated them like r/s levels and assumed they would act as possible s/r after the price had passed through those levels.im gonna look again at my charts bearing what you have said in mind.such basic mistakes seem to come easy in this game,just when you think you got it licked!!he he
p.s. v.good job your doin on this thread,cheers
TheTick
Member
- Messages
- 54
- Likes
- 3
Hello again jonj,
No, I wouldn't have taken the second one either. The second pin hits a support level but there is no PIVOT there.
That doesn't mean you shouldn't try these things (especially on demo). I am very particular in my trades.
This is the last trade I made which was yesterday afternoon:
Chart 1 shows that the market trades into an hourly pivot AND the 50 fib of the last major swing low. This means there is TWO strong supporting factors (highlighted by the blue rectangle)
Chart 2 is a close up.
I only took 52 ticks as I really wanted to leave the office and as a result was looking for a reason to get out of this trade but played by the rules I have outlined in this thread it would still be open.
Quick question on the Fib you have on this chart - where exactly does the 0% line attach to? It looks as though it is to the right of the pin, so would have occurred after the event. Please correct me if I am wrong or misreading the chart.
Also, I use Fibs quite a bit in my trading and am happy to use them as either support OR resistance. If a market swings, it may move to the 50% line, swing to the 62% line, then to the 38% line, etc. Everyone uses these things in different ways and as you say often there is no right or wrong way, just the way the trader feels comfortable.
grimweasel
Well-known member
- Messages
- 488
- Likes
- 108
So what are the pro traders in the city using? Do they just 'feel' the market and trade as they see fit (I think a few do!)
It would seem that the more one clutters one's chart with indicators the less likley one is to take a trade or find reasons for not entering.
Today I have departed from my plan to trade price action and candles only. No indicators. I'm trading live with a small amount so that I get to feel all the emotion etc that the market offers. That way I think I will have a much better idea of how things feel for real rather than trading a dummy account.
Initially things have gone well. There are a few smaller losses of say £10 here and there but then some larger gains of £50 or so from other moves. I do find the 5m TF rather daunting and I feel more comfortable with the 15m TF.
Tomorrow will be back to the plan!
BTW thanks again TD for the continued updates etc. You should be honoured in the New Year's List for services to Traders!! LOL
Grim
trader_dante
Veteren member
- Messages
- 4,535
- Likes
- 1,704
Quick question on the Fib you have on this chart - where exactly does the 0% line attach to? It looks as though it is to the right of the pin, so would have occurred after the event. Please correct me if I am wrong or misreading the chart.
The 0% attaches to the high of the pin and occured BEFORE the event.
mp6140
Established member
- Messages
- 742
- Likes
- 75
Hello again jonj,
No, I wouldn't have taken the second one either. The second pin hits a support level but there is no PIVOT there.
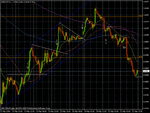
This is the last trade I made which was yesterday afternoon:
Chart 1 shows that the market trades into an hourly pivot AND the 50 fib of the last major swing low. This means there is TWO strong supporting factors (highlighted by the blue rectangle)
Chart 2 is a close up.
I only took 52 ticks as I really wanted to leave the office and as a result was looking for a reason to get out of this trade but played by the rules I have outlined in this thread it would still be open.
LOL ---- Im always amazed (or at least brought to a state of humor) by ALL of the ways one can play this game while still doing the same thing.
I played the same move but a touch differently because I obviously have different overlays on my chart. After going long off of the LRC bottom line, the s+r point, the 50 fib and close to the weekly pivot (white arrow --- I guess that was strong enough support to get my attention !)) I rode the long, dumped at resistance, took the short to support AND the DAILY pivot, and placed a few overnite long trades which have come home to roost, although i timidly didnt play the tp for OVER the LRC --- I get to be a tad chicken concerning trades while Im sleeping
Imagine the confusion for the newbs when a bunch of people do EXACTLY the same thing, but one tosses chicken bones, one works behind a curtain that puffs smoke, one uses the LRC and zigzags, one uses pivots, one uses MACD and the final one throws darts !
sure gets to be funny after a while, especially when each one of us insists WE have the way !
good trade guy !
mp
Attachments
TheTick
Member
- Messages
- 54
- Likes
- 3
The 0% attaches to the high of the pin and occured BEFORE the event.
Sincere apologies - I didn't zoom in the chart so couldn't see it properly.😱 Keep forgetting that I need to open them properly to see everything that's on there. Sorry about that.
trader_dante
Veteren member
- Messages
- 4,535
- Likes
- 1,704
So what are the pro traders in the city using? Do they just 'feel' the market and trade as they see fit (I think a few do!)
The majority I know use support/resistance combined with the order book.
Simple technical analysis such as head and shoulder patterns, channels, trend lines and flags are also often metioned as are fibs.
Also there is a lot of positions taken off the back of news. (I wouldn't advise this for the amateur - it is, in my opinion, one of the quickest way to lose your account)
No indicators.
👍DT
its true what ive read numerous times,that by the time youve learned about all the indicators and how they work and invented 50 systems,you begin to realize that all the best setups are best traded off price alone!!...mabye use them for timing the trade?a shame to waste all that work!!
happy huntin yawl,off to my real job
- Status
- Not open for further replies.
Similar threads
- Replies
- 3
- Views
- 2K

