SMB,
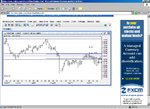
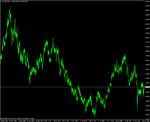
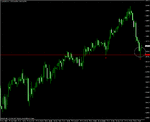
Look at the last three candles on your chart.
The first one is a doji - it represents indecision and not a firm rejection of a bottom.
The second one is also a doji but this time it has a range expansion. This means the bulls and bears are playing a little more actively now.
The third (at least on my chart) is a pin bar. It is a pin bar at a double bottom (zoom out and look left).
However, the pin's nose doesn't poke far enough out from the other bars on my chart (and is a tweezer bottom on yours) This is something that I like to see and as such I would most likely not have taken this setup.
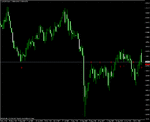
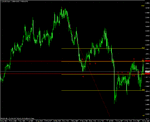
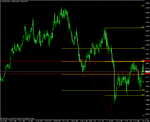
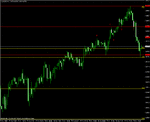
If I had, I would be quick to get my stop to BE on this as 1.1650 (which it is now testing) is first area of difficulty in my opinion.
I will take a reversal against the trend if I feel there is a strong reason to do so. I take many of the factors already outlined in earlier posts into consideration when I do. Trading against the trend can be very profitable but it can also result in the downfall of a trader. And it is important to remember that it is a very different game to trading with the trend and as such it has different rules.
More on this will develop over time.
It's difficult for me to post chats whilst at work but when I get home I am going to show you all an absolute stunner of an entry on AUD/CAD 1hr.
Thanks for your prompt reply TD, I look forward to engaging in live debate with yourself.
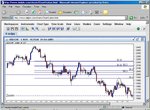
As we speak my first scale-out target has been hit just above the round number 1653. A case of trailing the rest for today's daily p/l target. 1670 is potential s/r zone on my charts.
Thanks
SMB
Last edited:

