OK, finally out of work for today...I've reviewed your earlier post Mark & here's what I've come up with:-
"Anyway, I did my first trade today (rightly or wrongly!). Noticed a pin bar on the daily GBPJPY last night and an hourly one formed this morning. haven't played the daily pin... "
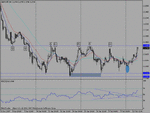
VS Comment #1: I opened the Daily GBPJPY chart in such a fashion that I can see exaclty one year's worth of data. The first thing that I notice is that this pair has posted recent lows around the 23rd Jan 2008 of approx 204.50. In particular, I believe this pair has been range-trading since 11 Januaty 2008, between the recent low & 213.50.
Certainly, we wish to see our pin bars occurring at (extreme) swing highs/lows. The fact that the pin occurs during a potential post 11 January 2008 period of consolidation worries me.
VS Comment #2: Now let's analyse the pin bar itself.
I've had a look at the latest daily bar - ie at 2008.02.10 00:00 - and this looks more like a doji to me.
The 2008.02.11 00:00 bar is still forming, but looks like a potential pin bar (albeit, not at a swing high or low). Please post the OHLC stats of the daily pin bar in question, if I have analysed the wrong bar.
I'll now use my pinbar worksheet to see if this pin satisfies the technical criteria.
Does it have a long nose in proportion to its body? As stated above, the bar I believe you're referring to is a doji => invalidates all the rest of the questions instantly.
..but played the hourly. Entered at 20850 with stop at 20677.
VS Comment #3:
OK, lets move the 1hr chart & see if any pin-bars exist.
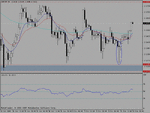
There is a potential bar (based on the rules of the pinbar spreadsheet) on the 1Hr charts at 11am, but it's nose certainly doesn't stick out far enough the low of the previous bar. I wouldn't play it as a result. Is this the bar you used to enter with?
At this stage, I'd have serious doubts that this is a high prob trade, based on t_d's method. I've drawn a line under at 11 am bar to see if it's a major S/R resistance pivot point - and if you think of t_d's training graph from a few pages ago, I don't believe it is.
In addition (!!), your risk to reward ratio of less than 1:1 is too low.
Conclusion - I'd have passed on this trade.
OTHER TRADERS, PLEASE GIVE YOUR FEEDBACK ON THIS!!!
Here's the key thing for you - I think you said you made 30 pips on your trade. The thing is, despite my comments above, you actually made profit!!
But here's what you have to consider:- we're looking for a high prob. edge that will consistently earn profits over time. Applying your set-up rationale to 30 or so entries - I believe - would leave you account in the red.
As I said earlier, just my $0.02!!
Thanks for reading,
VS


