trader_dante
Veteren member
- Messages
- 4,535
- Likes
- 1,704
Thanks for the info you've posted. Very interesting stuff.
What do you mean by this?
I mean the channel that runs between the 10 and the 21 EMA.
Thanks for the info you've posted. Very interesting stuff.
What do you mean by this?
I mean the channel that runs between the 10 and the 21 EMA.
I don't see it. Could you mark the original graph with the channel?
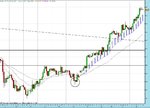
Sure. I've shaded it in blue.
Ah, thanks. When you wrote "into the zone" I thought you meant between the two MA lines.
I did!
Price retreats into the channel/zone that forms between the 10 and the 21 EMA.
This is what I have shaded in the chart above.
TD
Pyramiding
There's a second "main rule" imo:
no losing secondary position should offset the entire gains of the prior position(s)
You have to learn to ignore the lower timeframes if you want to catch the big winners.
More importantly you have to IGNORE your P&L.
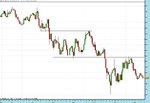
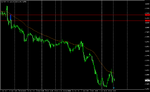
You entered on the daily TF. See chart 1. Your entry into a short position was clearly right and the market looks very weak and is heading into significant support with momentum.
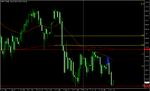
Now look at chart 2 which is the hourly TF. To catch this move you have to be prepared to ride the move through the noise and give back large numbers of pips.
Note how the first retracement swing, which caused you to exit, confirms what I have said about how the move will retrace to your entry even after a large move in your favour.
Short 1U GBP/JPY at 222.17 on hourly pin. Order to short another 1U at 222.20. Stops for both 222.81.
Entry in direction of hourly/daily trend. Short near major longterm support, so cover on bounce. First target is 221Y, which is also the support level. Total risk is 62 pips on both positions. Checked USD and EUR crosses, and the story seems to be JPY strength.
Exit plan - cover on a bounce from major long term support. Stop to BE on test. If stopped out, trade was wrong. If support breaks, wait for 3 hourly closes below the S/R pivot and then trail stop down above the 3 bar high.
Not the best signal, but I think it is worth a trade. Going to pull my additional sell order at 222.20 if 222 breaks first.
I saw that just now and thought of you, Lurker. Good luck 🙂