Hello All.
I have been reading thru this forum and a few seminars with great interest. And wonder if i could ask a couple of questions:
1. Determining weak/strong stocks to daytrade each day.
I think most people are using the N-min utility which Grey1 kindly provided, but wonder if anyone is using the top down approach (I think mentioned in the seminar last month ?). I.E. using market sectors which are strongest/weakest then strongest/weakest stocks in those sectors as an alternative way of getting a list of stocks to look at for the day ? For example using FinViz or Esignal scanner. Just wondering really of the relative merits of the two approaches.
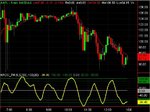
2. Someone posted a way of getting MACCI signals using either CCI or Stochastis with sma applied ? But i can't find the post now and maybe someone knows where it is. Essentially for people who don't have Tradestation and maybe want to use MACCI on Quotetracker or another charting system.
Many thanks in advance.
(1) For daytrading I would
always use the N-min utility. The N-min utility does not ,in itself , provide a list of stocks. It ranks the stocks that you have entered into Radar screen in order of weakness/strength compared to INDU at that moment in time, based on price movements over the last x minutes related to volatility.
How you provide the candidate list is up to you. In a previous seminar Iraj suggested that you could use Finviz to "collect" a population of stocks over a period to feed into the Iraj-N minute utility. You could use the Finviz heatmap or you could use the list given to JayJay recently.
There is no need to change this population all the time, as long as there are sufficient candidates for you to work with
(2) You take a CCI length 6 and apply an SMA smoothed over 5 periods.
The ELA code is shown below and you should be able to adapt it to whatever you are using
Charlton
-------------------------------------------------------
inputs:
Length( 6),
SmoothingLength(5),
OverSold( -100 ),
OverBought( 100 ),
OverSColor( Cyan ),
OverBColor( Red ) ;
variables:
CCIValue( 0 ) ;
CCIValue = CCI(Length) ;
Plot1( Average(CCI(length), SmoothingLength), "CCI" ) ;
Plot2( OverBought, "OverBot" ) ;
Plot3( OverSold, "OverSld" ) ;
{ Color criteria }
if average(CCIValue, SmoothingLength) > OverBought then
SetPlotColor( 1, OverBColor )
else if Average(CCIValue, SmoothingLength) < OverSold then
SetPlotColor( 1, OverSColor ) ;
{ Alert criteria }
if Average(CCIValue, SmoothingLength) crosses over OverSold then
Alert( "Indicator exiting oversold zone" )
else if Average(CCIValue, SmoothingLength) crosses under OverBought then
Alert( "Indicator exiting overbought zone" ) ;

