You are using an out of date browser. It may not display this or other websites correctly.
You should upgrade or use an alternative browser.
You should upgrade or use an alternative browser.
trendie
Legendary member
- Messages
- 6,875
- Likes
- 1,433
does anyone use Stochastics in their analysis ( successfully ).
I am going to abandon them, both DiNapoli (8,3,3) and LBR (7,10,4), after some forward testing.
Particularly unhappy about losing LBRs Stoch, as it seemed quite promising, but the signals are too late to use effectively, unless you are scalping, and you cant scalp with SB.
(even tried to get a decent trigger on shorter time-frame, but with no consistent edge )
DiNapolis book mentioned that Jake Bernstein noticed that rather than using Stochs as OB/OS indicators, they can be used to identify breakouts, as Stochs are essentially "where the current price is relative to a recent High and Low" ( range ), and thus, going Long over 75 or shorting under 25 could be profitable, as it may be the breakout.
If you observe the price over 75 or below 25 on any chart over past few days, there can be, on occasion, quite large moves. ( interesting use of Stochs in a contrarian way I thought )
In summary, I am abandoning Stochs.
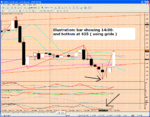
EDIT: as an aside, today showed a reversal at 15:00, the top being only a handful of pips higher than the 14:00 bar.
darktone
Veteren member
- Messages
- 4,019
- Likes
- 1,086
neil said:Bugger - bugger.............Memo; get an alert system or stop wandering away from the computor room 😱
http://www.sms2email.com/
i use a platform alert to send an email to the above. i then get a text sent to my phone if and order/level has been taken....been very reliable thus far...
neil
Legendary member
- Messages
- 5,169
- Likes
- 754
Darktone
Thanks for he link 😀
darktone said:http://www.sms2email.com/
i use a platform alert to send an email to the above. i then get a text sent to my phone if and order/level has been taken....been very reliable thus far...
Thanks for he link 😀
Uphios said:Ouch. Sorry for any cable players that were long but spare a thought to the sucker who decided to go long GBPCAD. Ouch and ouch again.
Sorry to hear that, but GBPCAD excellent for newstrading. But I don't like the spread: 10 pips right now (Saxo Bank). It's 2 more than GBPJPY. 😱
trendie said:and thus, going Long over 75 or shorting under 25 could be profitable, as it may be the breakout.
If you observe the price over 75 or below 25 on any chart over past few days, there can be, on occasion, quite large moves. ( interesting use of Stochs in a contrarian way I thought )
.
This is what that Baz chap was saying a few weeks back (whatever happened to him ??) Sometimes systems/indicators work, sometimes you have to invert their logical.
Pound to a penny you play it one way and it'll react the other though !!!
dc2000 said:mrng chaps its a short for me today
prefered entry at 525
Morning dc..how was the week off? Im biased to the short side too, but I think we'll see one last rise up to 550 region before a move down, barring any surprise euro rate hikes of course
dc2000
Veteren member
- Messages
- 4,766
- Likes
- 129
Hi Zuke
it was good but hectic it took me 2 days after coming home to recover. Manchester sure knows how to throw a party or three
didn't get my entry so will wait for a drop below 460 I would like another shot at the 370 area before more up tomorrow
The FTSE has caught my attention at the mo as is is signalling an unprecedented fall is coming
Final result for Hans for Feb....
The results of 02/28:
EUR/USD:
long at 1.1874, closed at 24.00 CET, result +54 pips
long at 1.1899, closed at 24.00 CET, result +29 pips
GBP/USD:
long at 1.7413, target price reached, result +120 pips
long at 1.7488, closed at 24.00 CET, result +49 pips
Total for the day: +252 pips
Total for this month: -13 pips
Hans
trendie
Legendary member
- Messages
- 6,875
- Likes
- 1,433
How can you objectively quantify the probability of a trend-line ?
If you throw enough lines on a chart you can "see" patterns, which may turn out to be coincidence.
I have recently been keeping an eye on geometry and support / resistance, and I can see patterns.
But, I want to know if I can quantify whether these lines have mathematical relevance.
( is it done by "calling" the extensions as a forecast, and then seeing if they come to fruition ? )
thanks
TheBramble
Legendary member
- Messages
- 8,394
- Likes
- 1,171
The Low of 1.7430 at 13:30 WHICH PRECEDED THE 14:00 BAR BY HALF AN HOUR rather precludes that as a possibility. 😆trendie said:the 14:00 bar has printed a low of 1.7435.
It couldnt possibly be the extreme of the day, could it ?
( allowing for some wiggle room of, say, 10 pips )
Which direction in time are you headed today and who are you getting your data from??? 🙄
And stop smoking that stuff - it'll really mess with your trading.
trendie
Legendary member
- Messages
- 6,875
- Likes
- 1,433
TheBramble said:The Low of 1.7430 at 13:30 WHICH PRECEDED THE 14:00 BAR BY HALF AN HOUR rather precludes that as a possibility. 😆
Which direction in time are you headed today and who are you getting your data from??? 🙄
And stop smoking that stuff - it'll really mess with your trading.
I am using MT4, and the 14:00 actually is the time-frame 13:00 - 14:00.
( on my charts the time shown is the time the bar CLOSES )
smoke ?! I thought you had to inject that stuff intravenously 😱
TheBramble
Legendary member
- Messages
- 8,394
- Likes
- 1,171
Slapped myself for assuming you were using 5 min bar. BUT, the low I have for that period is 1.7430. You are using the Sell?trendie said:I am using MT4, and the 14:00 actually is the time-frame 13:00 - 14:00.
Are you aware of the dangers of untreated Rizla debris in the bloodstream young man?trendie said:smoke ?! I thought you had to inject that stuff intravenously 😱
mickandpete
Active member
- Messages
- 176
- Likes
- 3
The 100 pt rise in Euro has been diluted on cable by Euro /Gbp rising from 6815 to 6860
Long term trend line should cap it at about 6875 alowing cable to folow Euro up if the charge continues
However these trend lines at present 6790 and 6875 will converge in mid/late April so beware
___________________.
Cribbing from 4Cast NY close above 12007 tech breakout heads towards 12047+ having broken through 50 DMA
Last edited:


