Best Thread learning to read price action with p/f charts

so..based on that chart
60 min data...but probably 15 and 30 min would have showed the same
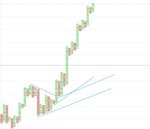
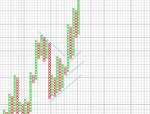
on 12 aug we got a triple top breakout. /orange horizontal...price recoiled and tested supp/yellow horizontal...second test,the market liked that and off it went/up...i placed a subjective trendline there..45 degree would have worked quite well
we then got a spike/ a pole...we would have been out on the 50% retrace on that pole and then price recoiled and broke the trendline...a break of trend ,but going into support,,,,that is where you will be working hard,by going down time input to see where support holds...then placing the order to buy with a tight stop.ie 1 or 2 boxes underneath.
price then broke out/dark red horizontal...we then got a retest of res /failed double-top..but we have placed a 45 degree trendline and we have the breakout point...possible potentiall supp,
but we would have been out at that failed test of res/double -top on a lower time input.ie ..the minute it looked like it was going to fail ie ..it retraced from res
 
Last edited:
still on 60 min data
the look back period is longer...shows the previous trend
a higher box size and on a close plot
we are at an area of prev horizontal res and coming into trend res
so..now we have to work hard to get the support areas and see if they hold
we work out supp areas and see what happens when they get tested..however,if the news is right it could break thru the res without testing supp.If that happens we wait for the retrace of the next res area and look hard for the supp area
we are just working the trend
clear as mud ... !! eh

8wbgpc.gif
 
Last edited:
forgot to mention..there was a quick short trade from that high pole down to 50% of the low pole..if you were really keen
next ..we want to locate supp to go long...OR ,very importantly...to see if it fails and we go short
enclosed chart is to look at s/r
supp..we are looking at a horizontal 0r trendline cluster
res is marked
need to see the reaction at the test of these
if it bounces off support..we are looking for a retest or consecutive buy signals on a lower time input
otherwise price consolidates and we do some congestion analysis
short..we watch the reaction within that zone when price hits a res or goes near
same again ,we want a retest or consecutive sell signals
chart is of general picture

vgpv2c.gif
 
Last edited:
short trade..you need to watch this area/aqua horizontal .9300
should bounce there if it tests


311pg0g.gif
 
Sanjay
update on our audusd short
uptrend got broken on 19 aug
remember we highlighted .9300 area.it did bounce there and then retested it
note how we had a failed signal on 19 aug and then it tested .9300 area.failed signal is an entry
so on 19 aug..another signal was break of supp'aqua which is at .9310.We then had a decent run downwards
we took profits and then it recoiled..there was a buy on the recoil there aswell
note on the recoil that the aqua line was res.the short sellers saw this and went in for the kill.another trade put on at res

23h53zs.gif
 
Last edited:
Hi Dentist
Great thread - working my way through all 145 pages slowly and reading the book by J Du Plessis.

I currently use Sharescope Gold and IG to spread bet UK and US stocks.

SS does plot p/f charts but from a brief look is does appear it is not a SS strongpoint (more of an after though by them) - maybe I am wrong?

As a beginner with p/f is it possible to use free internet based charts and then progress to BEB or another PC based software? I don't want to frustrate myself with inferior charts if the "right" thing is to buy better software from the off

I see myself as more of a "medium" term trader using EOD data to trade over periods of a few days to a few months (no time at work to sit in front of a screen)

Any advice for a starting newbie in this area in terms of software options.

Cheers

Andy

Take a look at this thread Andy
http://www.trade2win.com/boards/trading-software/190604-point-figure.html#post2382138

The free internet based ones are all going to be inferior, and will not plot the boxes properly which means your trend is harder to identify and clear breakouts harder. I'd advise a good package, and Sharescope is not that for P&F. I've been there and it was a horrible experience (n)
Bulls Eye WAS the best, but that's changed now in that their latest version is just so inferior to the original as they tried to incorporate all charting styles they've lost the plot a little. You can only see such a small section of data at a time I found it next to useless.
Take a look at some of the others I've mentioned and others mention on the thread I've put up. Hope that helps you

Many thanks Malaguti
I will check that thread out and not waste anymore time to see if I can make "a silk purse out of a sow's ear" using sharescope!
 
Last edited:
Many thanks Malaguti
I will check that thread out and not waste anymore time to see if I can make "a silk purse out of a sow's ear" using sharescope!

Ok - it does seem that the only worthwhile options are:

BEB version 4 if I can find and download that version
Updata GBP 499
Investor RT $45 or $70 per month
or / Graph paper and a lot of patience!

Looked for some excel versions but nothing jumps out as being suitable
 
Ok - it does seem that the only worthwhile options are:

BEB version 4 if I can find and download that version
Updata GBP 499
Investor RT $45 or $70 per month
or / Graph paper and a lot of patience!

Looked for some excel versions but nothing jumps out as being suitable

good luck with version 4. And if you find one, let me know. I tried and failed.
Updata is the very best. I had issues with their own data supplier, so I changed also to the international version (I think that's your £499). Remember this is an annual cost.
Investor RT, I've never used, so if its good let us know but 70/month is even more expensive than updata.
If it was a choice of RT at just under 1000/year!! I'd go with a one off payment to Market Analyst. It really is a lovely piece of software that one.

Anyway, your choice of course and good luck.
 
Ok after some thought (and based upon my low trading balance) I will start with Stockcharts as it is free and if i use my large monitor the charts are clear. In terms of accuracy what is the issue if the boxes are not perfectly square?

I assume that the difficulty is with drawing trend lines?
Is the problem that the boxes are not square OR is the issue that every box is not identical?

I would guess as long a trend lines are drawn from box corner to corner and IF every box has an identical height/width ratio (but not square) that everything should still be OK?

I emailed updata for a trial but a week free is not exactly generous!

I like Stockcharts, good choice. I'd use them were it not for the markets they provide.
You're right, its due to the trend lines which are fundamental for the trend, and provide dynamic support/resistance. If the charts can't be squared you can't know where this support might kick in. Also breakouts are harder to really identify
Here's an example from a squared and non-squared chart
In the non squared I'm trying to apply 45 degree trend lines which are impossible, yet I've drawn them as the boxes line up.

Now when I square the chart, its clear where my trend lines should be drawn and clear where the breakouts actually happen.

hope that makes sense
 

Attachments

  • non squared.JPG
    non squared.JPG
    43.4 KB · Views: 149
  • squared.JPG
    squared.JPG
    112.3 KB · Views: 181
I like Stockcharts, good choice. I'd use them were it not for the markets they provide.
You're right, its due to the trend lines which are fundamental for the trend, and provide dynamic support/resistance. If the charts can't be squared you can't know where this support might kick in. Also breakouts are harder to really identify
Here's an example from a squared and non-squared chart
In the non squared I'm trying to apply 45 degree trend lines which are impossible, yet I've drawn them as the boxes line up.

Now when I square the chart, its clear where my trend lines should be drawn and clear where the breakouts actually happen.

hope that makes sense

(y) Very clear from the pics.

p&f looks like a method which is worth me putting some effort into as the signals are clear and it all seems logical. Getting some graph paper today for a play and even thinking of Matlab as it has a routine for plotting the charts - but would take much manual effort in getting the historical data me thinks.

Do you trade this method and in what timescale? also the obvious question do you have much success with it?
 
p&f looks like a method which is worth me putting some effort into as the signals are clear and it all seems logical.
Well worth getting to know. I only started becoming consistent when I started using this method. I honestly believe even beginners should start with this simply due to all the components of a great system.
Do you trade this method and in what timescale? also the obvious question do you have much success with it?
I haven't re-subscribed to updata yet which only just ended. That's only due to the issues I had with updata themselves and their data and complete lack of attention to getting things right. It has put me off using them again.
I'd love to get back to using the method though and combining its strengths with another strategy which I'm enjoying using right now. Which helps me overcome one of the negatives of P&F and that's the tendency to curve fit a chart.
Also I've found better exits which keep me in the trade much much longer. In time i will look to combine these two methods, but P&F will always be there.

Was I successful? yes but at longer timeframes. I honestly can't stress enough how great a system it is. consistent returns with high accuracy for winning trades.
But I also know a few very well who have looked at this and can't make it work for them. So perhaps I was lucky, I don't know. They tended to look at shorter time frames though.
But you must learn it, use it and trade with it and then with proficiency and understanding you will begin to recognise those strengths and weaknesses which I'd happily expand upon but I wouldn't want to disrupt Dentist's thread anymore which is testimony to how it can be traded intraday and the charts properly read.

Hope this helps mate and let us know how you get on with stockcharts.
I have never used matlab so I can't comment on that I'm afraid
 
Top