Indicator that won't fail - why? Why most others fail?

ronposit

Newbie
Messages
3
Likes
1

Why Most Trading Indicators Fail—and Why Mine Doesn’t​

Logical Reasons Indicators Fail
  1. Lagging Nature of Indicators: Many indicators rely on historical data, making them reactive rather than predictive. This delay often results in missed opportunities or late entries/exits.
  2. Market Conditions Change: Indicators are typically designed for specific scenarios, such as trending or ranging markets. When the market transitions, these tools often fail to adapt.
  3. Over-Optimization (Curve Fitting): Traders often tweak indicator settings excessively to fit historical data, creating the illusion of accuracy in backtests. Unfortunately, this rarely translates to live market performance.
  4. Ignoring Market Context: Indicators analyze isolated data points, but they fail when traders neglect the broader market environment, including news, sentiment, or macroeconomic trends.
  5. Psychological Misuse: Emotional trading—whether driven by greed or fear—often overrides the logic of indicators.
  6. Indicators Are Derivative Tools: Indicators are built from price, volume, or time data. They don't generate new information but merely highlight patterns, limiting their predictive power.
The Real Reasons Indicators Fail
Most indicators share a fundamental flaw: they’re derived from the same small set of mathematical formulas, such as moving averages, RSI, and stochastic oscillators. These formulas are rehashed, rebranded, and presented with slight variations, offering little real innovation.

Moreover, many traders using these tools have no understanding of their original purpose. The creators of these indicators often designed them to simplify their own analysis—not to fully automate trading with a "buy and sell" simplicity. This disconnect leads to misuse and unrealistic expectations, causing frustration and losses.

The problem intensifies with modern indicators that attempt to predict market behavior. Prediction introduces a significant margin of error, as markets are influenced by countless unpredictable factors.

The Hallmarks of a Good Indicator
A good indicator does not attempt to predict the market; it reacts to and confirms market behavior. It observes, measures, and responds rather than assuming future movements.

I don’t claim to know every great indicator out there, but I know one that works—mine.

Why My Indicator Stands Apart
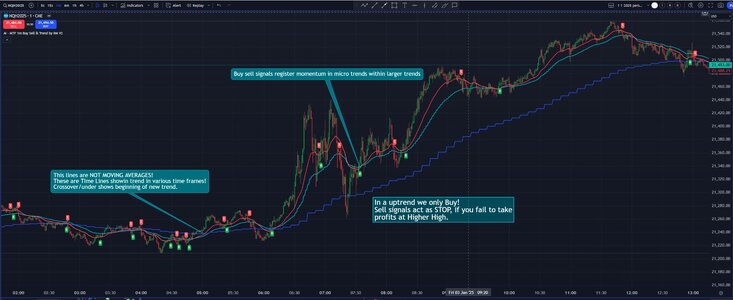
  1. Trend Reversal Detection: It identifies and measures trend reversals, marking the beginning of new trends with precision.
  2. Multi-Time Frame Analysis: It evaluates trends across multiple time frames simultaneously, ensuring signals are grounded in a broader market context.
  3. Buy/Sell Signals: Signals are issued based on micro-trends within major trends, confirmed by analysis across multiple time frames.
This tool is the product of years of learning from methodologies like Elliott Wave Theory, Wyckoff principles, price action, and smart money concepts (SMC). Hundreds of lines of code bring these principles together in a highly effective system that eliminates the guesswork.

Beyond the Indicator
To prevent misuse and maximize its potential, my indicator comes with a mandatory two-hour instruction session. This training covers market context, structure, and the nuances of proper application. Without this foundation, even the best tool can lead to poor outcomes.

In the end, an indicator is only as good as the trader using it. With the right education, tools, and mindset, traders can turn frustration into confidence—and losses into consistent gains.

I personally trade NQ futures, attached is an example of Friday, Jan 3, 2025 indicator in action. All questions will be answered, free personalized one-on-one demo is available and encouraged.
 

Attachments

  • 1f.jpg
    1f.jpg
    225.3 KB · Views: 24
Interesting! How does it handle sideways market?
Hi, thank you for reading my post. If you recall, I do not just sell my indicator, it comes with mandatory training, which addresses numerous issue, such as stop loss, take profit, times we do not trade (we have economic calendar), know your market (each security has it's own market timing), proper time frames for day trading, where by indicator catches the lease amount of "market noise" often associated with sideways market. So to answer your question - indicator, depending on time frame will either show conflicting signals for a duration of the choppiness or will ignore the choppiness if in a slightly higher time frame. Indicator does precisely as intended and does it well, it is us the humans, who need to be aware of this phenomena (sideways market) and learn to either avoid it altogether or learn how to deal with it. I am a strong proponent of quality education! I hope I answered your question.
Attached is an example I personally run into yesterday, Proper STOP LOSS, helped me avoid unpleasant chop and yielded in a profit:
 

Attachments

  • 1n.jpg
    1n.jpg
    133.7 KB · Views: 15
Hi, thank you for reading my post. If you recall, I do not just sell my indicator, it comes with mandatory training, which addresses numerous issue, such as stop loss, take profit, times we do not trade (we have economic calendar), know your market (each security has it's own market timing), proper time frames for day trading, where by indicator catches the lease amount of "market noise" often associated with sideways market. So to answer your question - indicator, depending on time frame will either show conflicting signals for a duration of the choppiness or will ignore the choppiness if in a slightly higher time frame. Indicator does precisely as intended and does it well, it is us the humans, who need to be aware of this phenomena (sideways market) and learn to either avoid it altogether or learn how to deal with it. I am a strong proponent of quality education! I hope I answered your question.
Attached is an example I personally run into yesterday, Proper STOP LOSS, helped me avoid unpleasant chop and yielded in a profit:
Your indicator does a good job. Typically you manage choppiness using STOP LOSS?
 
Hi, the answer is as follows:
1. My indicator & chart layout, allows me to trade on either or all of 3 time frames. The larger the time frame, the less my trades effected with the "noise".
2. My students are introduces to a true market structure/pattern, knowing the pattern is #1 thing in trading. This knowledge tells me where we are going & indicators confirms it - thus I know that my stop loss is in the right place and will hold (for correctness, I will say, will most likely hold)
I developed my indicator for:
1. Myself! It validates my opinion of the pattern (sometimes without statistics and calculations of the indicator it is quite difficult/confusing)
2. For people who are looking for easy way of trading without contextual knowledge of the market. Some people just don't care to learn, some are just limited in their ability to learn and retain info.
Either way it works. You know, I bet you I will shock you with this - you can literally toss a coin every morning and coin will decide if you will take only "buy" or only "sell" signals. Guess what? Indicator will either restrict your trading, or will lead you to huge profits! This is 100% guaranteed! No brains of market analysis is required!
 
Back
Top