Ideas for increasing trader performance

Status
Not open for further replies.
Do you always use the weekly levels and are there any times you add the 4 hour levels?

ps: you have really been a great help

Thanks
Wade

The weekly time frame is really just a zoom tool for me.

It allows you to see further back without shrinking the action too much.

I don't look at the 4hr.
 
I thought I would go over a trade I took today in light of the principles discussed in the PDF. Most notably mapping the market with regard to the top down approach and knowing the markets rhythm to play the retest in your entries.

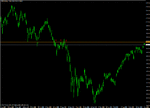
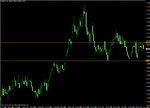
Yesterday (Monday) I was watching the FTSE on the daily time frame as it trades into a level I have marked on my charts. see chart 1

As the market hits this level I am feeling decidedly bearish but I am not ready to sell.

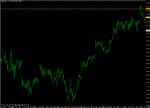
The FTSE punches through this level in early morning trade and then reverses and trends down for the rest of the day.

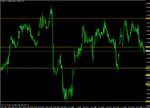
I watch this reaction on the hourly time frame. see chart 2. I am expecting to see the fall capped by the top of the hourly range - for previous resistance to become support. As you can see, the market holds here temporarily and then after a short lived bounce, we trade down back into the range. This area is now expected to become resistance once again should we get up there.

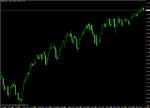
As we head into the close it is time to look at the S&P500. The daily candle is finishing like this.... see chart 3 No prizes for guessing where the probability is that that is going to be going in the next session...

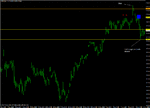
As the FTSE futures are nearing closure it is heading back into the resistance we marked above. I sell the FTSE around 5507 (the blue box) putting a stop above the high. see chart 4

The market sells off sharply today on the open this morning.

Note where the first bounce of the day comes. It is at 5455. What a surprise.

I don't get out here because it is my belief that a support level that is regularly hit is going to break. The target is 5413 which is an hourly level based on previous highs that can be clearly seen in the last chart.

The mark collapses into this level but does not quite hit my limit - I have it just a few ticks lower. There is a bounce through which I sit tight and then the market comes down again. It is hovering above 5413 just five minutes before the trade balance. Not willing to take the risk of adverse news when the market is close to my limit order, I close out manually.

The market takes off after the figure and moves upwards. Where does it find resistance? Right where you would expect it too.

Remember the plan forms slowly from the top down.
 

Attachments

  • ftse1.gif
    ftse1.gif
    24.3 KB · Views: 1,072
  • ftse1_h.gif
    ftse1_h.gif
    22.1 KB · Views: 953
  • sandp.gif
    sandp.gif
    22.4 KB · Views: 983
  • ftse2.gif
    ftse2.gif
    26.1 KB · Views: 960
Last edited:
What's on the agenda for tomorrow? Quite a lot but I will post only one because I have been working all day and I am off to watch the rest of 24 which I am getting steadily hooked on.

EUR/GBP

Taking a top down approach, the market has found significant resistance up at 0.9026 and formed a bearish engulfing on the daily time frame. The next big daily level is quite a way lower at 0.8839. This pair loves to range so I think it has a decent chance of making it down here.

Let's come onto the hourly. There are four levels on my charts between where we are now and the big daily target. That's a good opportunity to divide the total position size into four and scale 1/4 out at each. As each 1/4 comes out, we can run a trailing stop on the rest.

So where to get in? Well it's a bearish engulfing and these usually suffer some retracement. I'll look to sell 0.8968 which is the first hourly s/r pivot with a stop above the last swing high at 0.8984 (which also give you cover provided by the 38 fib ret). That gives you a stop of approx 16 pips (+ spread) and it's 43 (- spread) to your first target.
 

Attachments

  • eur.gif
    eur.gif
    25 KB · Views: 893
  • eur2.gif
    eur2.gif
    31.8 KB · Views: 804
hi trader_dante, i tried to find the support/resistance and this is the result.. i think trader needs a trained eye to do this properly. im still kinda lost for this chart about the 'future' support/resistance.

may i know your eur/usd daily lines? thx
another important question is do you still using the old way as described in "making money thread?" because your above latest eur/gbp chart didnt have any arrows so its gonna be confusing for new learners.
 

Attachments

  • eu_daily.GIF
    eu_daily.GIF
    19.5 KB · Views: 500
Last edited:
this is u/j & aud/cad, hope someone or trader_dante able to correct me
 

Attachments

  • uj_daily.GIF
    uj_daily.GIF
    18.9 KB · Views: 424
  • aucad_daily.GIF
    aucad_daily.GIF
    18.1 KB · Views: 387
Last edited:
Those that are bullish stocks will be looking to get in long around these levels. FTSE looks the most promising. Wait for it to set up right for you. If it doesn't, pass on it.
 
I had a few ideas about how some of you can increase your performance.


What performance, are we looking at this with a view to more money for less effort? Performance is experiential in terms of technical ability and then a person can only play around with different MM techniques to complement thier abilities.

I think noobs would like to see your true MM techniques rather than a channel or a pin-bar set-up.

Just a thought mate.
 
EUR/GBP

Taking a top down approach, the market has found significant resistance up at 0.9026 and formed a bearish engulfing on the daily time frame. The next big daily level is quite a way lower at 0.8839. This pair loves to range so I think it has a decent chance of making it down here.

Quick update on call above...this is going to make a play for 0.8839. Keep an eye on this. Very critical level. There is going to be alot of action there.

This and the stocks (see last post) is where you want to be concentrating at the moment :)
 
I've asked them to re-instate the old username, but incase they turn me down I though't I'd add to what TD has mentioned already (also I have a question I want to ask so trying to knock up a few brownie points - if only there was some sort of system for that!). I think it's safe to say that our strategies are fairly similar, so these few points should be pertinant for anyone taking an interest in what TD has said already.

I don't have a disclaimer as long as his, so if you don't like it ignore me.
++++++++++++++++++++++++++++++++++++++++++++++++++++++++++++++++++++++++++

in no particular order:

What's Hot and What's Not? Before you mark in your levels, eyeball the chart and decide if it is trending or stuck in a bracket; some things are trending, some things are ranging - cull your "possibles" to "probables" right here.

If you are struggling to pick out levels...don't worry about missing some - just make sure the one's you've got are sensible. As a first step, I always (always!) look for Support becoming Resistance (or vice versa). Search for BBmac's posts and take a look.

There are different types of level. In addition to SbR / RbS (w/ fibs), there are also trendlines, Value Areas (POC's) and even moving averages... once you get the hang of plain S/R, you can use the same techniques in different situations - it's worth learning.

You can use levels to trade patterns. For example H&S (and their failures), flags, pennants... different incarnations of the same phenomena.

Market structures are fractal, Market factors are not. A 15m chart will look pretty similar to a weekly chart if you take off all the numbers - however the factors that are the driving force behind prices change dramatically over timeframes. To quote Benjamin Graham "In the short run, the market is a voting machine, but in the long run it is a weighing machine". Know where your skills lie in the pecking order of price determination.

As a general rule, for price levels of all types... Longer timeframes > Shorter timeframes; Recent levels > Distant levels; Always move DOWN timeframes, never up (i.e. don't look for an hourly level to show up on a weekly chart).

Levels don't last forever!

Good signs: Being tested from the other side (e.g SbR / RbS); Untested from same side (e.g dbl btm / top)

Bad signs: Eroded by time - if the mkt doesn't pay attention to a level you have in, neither should you; A line in the sand... is likely to be crossed - a level that has been tested for the 4th time is less likely to hold in it's 5th.

++++++++++++++++++++++++++++++++++++++++++++++++++++++++++++++++++++++++++

Good posts TD

G
 
Good posts MrGecko and good to see you back!

I'm off to bed now...must be ready for the mornings rally in the FTSE ;)
 
Tom, MrGecko: please keep the good stuff coming. The examples are an incredible tool to get unstuck.

Ilya
 
Tom, MrGecko: please keep the good stuff coming. The examples are an incredible tool to get unstuck.

Ilya
 
Hello Tom,
I am reading your blog "Making money trading". I have read 65 pages till now and intend to finish it soon. In the beginning of it, you said that you use fibonacii retracements, r/s, ema, in confluence with pib bars. Till now, what I have read, you don't mention much about ema. So, in context of that I have a quick question.

Let's say that in EURUSD you take 21ema, and then may look for the confluence of pin bar with it ema and fibo retracement. My question is that why look for confluence with ema here? What does it tell us? I can fully understand that we look for pivot points, swing high and lows, r/s but why ema? ema is just a secondary indicator telling us the history. Is it because we have other traders who use ema and we also wish to see what they are watching?

Since the blog "Making money trading" is closed now, so I thought to ask you here. Feel free to ignore my question, you are under no obligation to answer it obviously.
Thanks

Good posts MrGecko and good to see you back!

I'm off to bed now..QUOTE]
 
Hello Tom,
I am reading your blog "Making money trading". I have read 65 pages till now and intend to finish it soon. In the beginning of it, you said that you use fibonacii retracements, r/s, ema, in confluence with pib bars. Till now, what I have read, you don't mention much about ema. So, in context of that I have a quick question.

Let's say that in EURUSD you take 21ema, and then may look for the confluence of pin bar with it ema and fibo retracement. My question is that why look for confluence with ema here? What does it tell us? I can fully understand that we look for pivot points, swing high and lows, r/s but why ema? ema is just a secondary indicator telling us the history. Is it because we have other traders who use ema and we also wish to see what they are watching?

Hello swedendenmark, the reason I don't mention the EMAs is because I don't use them anymore.

My trading has changed quite a bit since MMT although the foundation and basic principles I still apply are very much the same as those found within the thread.

I haven't read the thread since I wrote it but from what I can remember, I would say that the main differences between the way I trade now and the way I outlined in MMT are:

1) I don't trade directly off the daily (or higher) time frames any more. I merely use them to look for entries on the hourly now.

2) I don't trade as many markets. I now watch and trade just twelve markets.

3) I don't use moving averages any longer. The reason I took them off is not because they don't work. The concept of the 50 trending and the pullback to the 10-21 zone is a powerful one and led me into many good trades. However, over time, I take things off my charts because I believe the simpler the better and I wanted to try and perfect the reading of price alone. I don't advise that everyone that follows MMT suddenly take EMAs off their charts. They are a great thing to have on your charts while you are in the learning stage because they give you an important frame of reference with which to watch the markets rhythm.

4) Although I still use Fib levels my use of them is limited. This is for the same reason above. I am trying, over time, to take things off my charts until I am left with nothing but the price.

5) I no longer use candlestick patterns for my entries. That is to say, I don't trade using pin bars or inside bars etc. This is the main difference that everyone will notice. The reason I stopped using them is because I started to be able to anticipate where the market was going but wouldn't get the perfect setup. When I saw that they were holding me back in this regard I moved on. However, do not underestimate how powerful a tool they are and how much they can help you.

6) I don't trade using stop entry orders any longer. This is directly related to the fact I don't use pins etc any longer. I trade just watching the price and entering with market orders when I feel it looks ready to move in my anticipated direction or limit orders if I am confident in a level.

7) I don't use the same philosophy behind my trade management. That is to say, I don't apply a trailing stop principle as methodically as I outlined in that thread. I tend to exit around levels.

So, some of you might be thinking, what do you still do that is the same and is it worth me reading the thread in the first place?

What I still do that is apply the principles that I have always said were the most important parts of that thread:

- I still use support and resistance and still draw it exactly as I outlined in that thread

- I still use the concept of the retest on all market patterns that I see

- I still use a top down approach looking first at how the market is shaping up on the daily time frame and then moving down to the hourly to fine tune

- I still use a whole lot of patience to only get in at what I feel is the right moment which can mean stalking a market for quite a time.

Having noted what I do now and how it differs, I still maintain that a new trader should follow what the thread advises. If you follow and apply the principles you will be able to grow an account and even trade for a living.

Let me repeat: nothing that I wrote in that thread has stopped working.

If you are new to this, keep the moving averages on your charts and keep plotting your fib levels. They show you areas of confluence which increases the probability of a successful trade and is one of the most powerful tools in your arsenal.

Keep using the candlestick patterns - they are confirmation for you and they are very powerful.

Have the discipline to trail your stops in the way I illustrated - it will help you to catch the big moves.

Over time, you may find you begin to slowly change your style. Some elements you will keep, some you will take off, some you will add that never existed for me. Some of you will move up time frames, some of you will move down them.

In essence, you will begin to find your own way which is the most important part of all this.
 
Last edited:
2) I don't trade as many markets. I now watch and trade just twelve markets.

Hi Tom,

I agree with everything you have said about taking things OFF your chart, I did the same and at first it was difficult, but over time you begin to feel more natural with your chart, almost like a friend you've known for years! If you're using EMAs, Fibs, etc all the time and they stop working, the average trader is likely to panic.

I just wanted to ask you about this part I quoted though -- what markets do you trade? I am only sticking to Forex as I hate to hold positions overnight on other markets since they could gap, but I do want to start reaching out to others. What are your favorites?
 
I'm enjoying reading this thread right now because it is basically confirming lot's of things I have learnt over the last 12months since I decided to learn to trade on price alone. It is hard work but ultimately worthwhile as it has provided me with a degree of flexibility to trade in any market conditions which I am now finally reaping the benefits of.

What I also draw from this thread though is just how experiential learning to trade price is and nomatter what great guidance is provided by Tom and MrGecko, there is still no substitute for having a go and making an @rse of it.

What I also found invaluable over the last 12 months was learning about the structure of the market and what really drives price around, including the mood of the market, the correlation with other instruments, the news and getting a feeling for the ebb and flow of things.

Keep up the good work boys. Very philanthropic and nice to see something put back in rather than lulz or trolling.
 
Hi Tom,

I agree with everything you have said about taking things OFF your chart, I did the same and at first it was difficult, but over time you begin to feel more natural with your chart, almost like a friend you've known for years! If you're using EMAs, Fibs, etc all the time and they stop working, the average trader is likely to panic.

I just wanted to ask you about this part I quoted though -- what markets do you trade? I am only sticking to Forex as I hate to hold positions overnight on other markets since they could gap, but I do want to start reaching out to others. What are your favorites?

Or you could leave them all on and add to them and get 6 monitors so it *looks* like you're busy, despite the fact you only work off 1-2 hr tf's (using one pc and or laptop) using price action and one MA...;)
Part of conversation with 8 yr old Son; "so you guess that *it* either goes up or goes down and decide when's the best time to jump in? And you might lose money or get some?" "er....well its a bit more complicated than that Son"...:eek:
 
Status
Not open for further replies.
Top