The best trade could be in the opposite direction when a classic price pattern doesn’t behave according to perfect rules outlined in popular books and web sites. In fact, well-known patterns such as the head and shoulders and bull flag have clearly defined levels that can trigger trade entry signals that are contrary to the direction in which they're naturally leaning. Alex Elder examined this phenomenon with his Hound of the Baskervilles signal in Trading for a Living when he highlighted a head and shoulders neckline that just wouldn’t break, encouraging observant traders to jump into long positions, rather than following the herd and selling short
We're taught early in our trading careers to buy breakouts and sell breakdowns, but many contrarians attempt to pay the bills doing the exact opposite. Simply stated, they wait for a rally or selloff to fail and sell the breakout or buy the breakdown. Oppositional tactics don't end there because tacticians employing these against-the-grain methods take the concept one step further and buy when the failure fails. Let's back up and examine this inverted thinking one step at a time.
Most of us follow a common path -- we pile into stocks, futures or forex pairs when they break out above easily observed resistance, but modern algorithms have been programmed to anticipate exactly how human traders will react when a breakout fails to attract momentum and rolls over. Using this knowledge, they intervene and guide price action down to levels where breakout traders are trapped and execute rapid fire short sales to generate additional downside momentum that completes the failure swing
Now, twist your brain and take this contrary reasoning to the next level. You’re victimized by this diabolical price action enough times that you learn from your experience and sit on your hands when a favorite play breaks out. The rally stalls and it sells off but you still wait, watch and do nothing. Then, once selling pressure has dissipated and it closes back above the breakout level, you jump in and buy, knowing that weak-handed players are no longer positioned. Make sense?
Let’s deconstruct what just happened. The original breakout attracts the typical momentum crowd, chasing the stock, futures contract or forex pair to higher ground without too much thought or strategy. The upside fizzles out and price turns lower, trapping those who haven’t protected positions with stops or profit-taking strategies. Fear takes hold when the decline cuts through the level that first signaled the breakout, forcing additional downside that sets off more bearish signals. The falling instrument eventually finds its footing and bounces in a fresh assault that penetrates the broken level. New buy signals go off, drawing our contrarian into a long position.
How do algorithms know where human traders will act emotionally? Simply stated, most of us take market exposure utilizing common strategies that have been deconstructed by smart money and their software code. As a result, stock, futures and forex prices seem to pass through support and resistance levels more easily now than in the past. Fortunately, when modern markets find new ways to take your money, they also provide new ways to make it.
Let’s look at three pattern failure setups and find contrary ways to profit from them.

A. A-B-C Failed Breakout
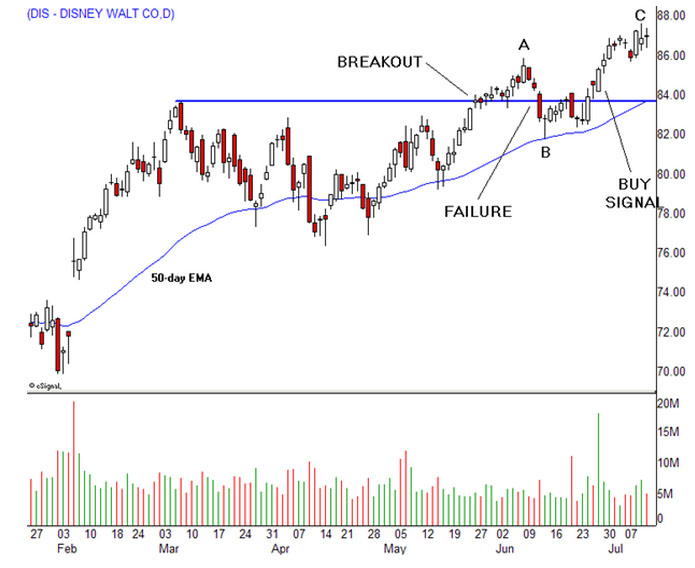
Walt Disney (DIS) topped out at84 inMarch after a strong rally. It built a trading range into May and broke out, but the uptrend stalled just two points higher, giving way to a failure swing that broke new support (blue line). The decline ended at the 50-day EMA, with the Dow component testing new resistance for two weeks and then surging higher. The second buying impulse off the low triggered a failure of a failure buy signal that preceded a new rally high.
It helps to visualize the breakout process as A-B-C wave patterns in which “A” marks the initial breakout surge, “B” the failure swing and “C” the resolution wave that lifts the price to a new rally high, or completes the failure with a decline that breaks the “B” low and sets off all sorts of short sale signals.

B. The 50-day EMA Flush
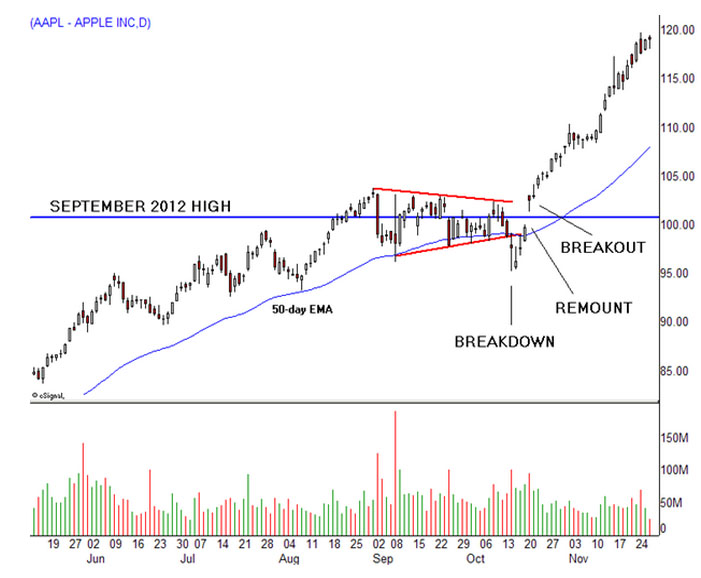
Apple (AAPL) ended a historic rally near101 inSeptember 2012 and entered a long correction. It returned to resistance in August 2014 and spent two months grinding sideways on top of the 50-day EMA (exponential moving average), before breaking down on October 15th. The stock hovered under new resistance for three sessions and shot higher, closing back above the 50-day EMA and then breaking out in a major uptrend just one session later.
This pattern failure occurs frequently, but many traders fail to notice the enormous opportunity it sets into motion, especially when price action unfolds in a widely held issue like Apple. It also illustrates how failure swings can interact with other charting features, generating positive feedback loops that ignite long-term trends. This is especially true when the 50-day EMA comes into play because it denotes the most common intermediate support level, with successful tests having the power to draw many sidelined players into new long positions.

C. The 62-78 Fibonacci Whipsaw
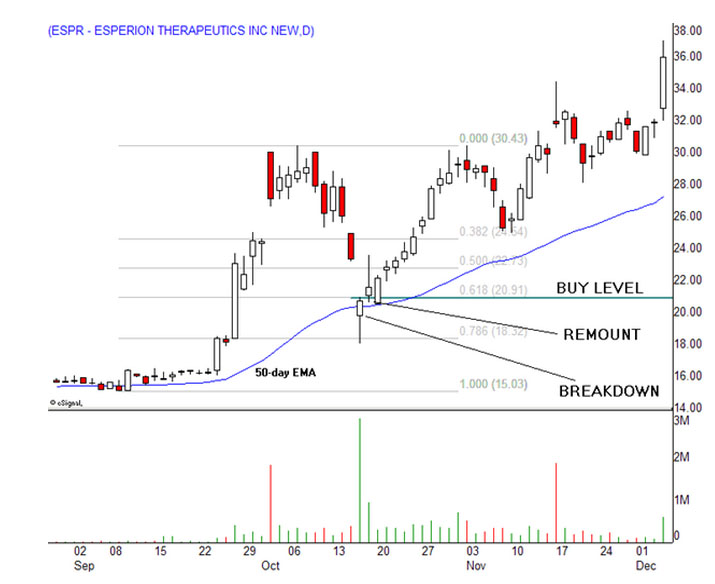
Small cap biotech Esperion Therapeutics (ESPR) tapped into a supply of momentum traders when it broke out of a long base in September 2014. The vertical rally nearly doubled the stock’s price in just two weeks, yielding a short-term top at 30.38 followed by a steep retracement that accelerated mid-month, when it gapped down into the upper teens on heavy volume. A Fibonacci grid placed over the edges of the uptrend organizes the chaos, with the decline breaking typically strong support at the 62% retracement and coming to rest at the 78.6% retracement. This 62-78 failure combination occurs frequently and often precedes a major buying opportunity by a few price bars. The trade entry strategy is simple: wait for price to close back above the 62% level and enter a long position as close to that price as possible
Intraday traders should find this pattern failure technique especially useful because it shows up frequently on 15-minute and 60-minute charts. Relatively tight stop losses are needed regardless of holding period because price action tends to be volatile near these major inflection points. It also helps when other support criteria align with the 62% retracement level, like the 50-day EMA in this example.
In Summary
Pattern failure setups can provide higher reward opportunities than textbook strategies because they catch the emotional crowd leaning the wrong way. While most traders understand how patterns are supposed to work, they get confused when real-time market behavior doesn’t match their expectations. In addition, they tend to put on blinders and get trapped as these failure events unfold. This deer in the headlights paralysis feeds on directional movement until the pain becomes too great and they capitulate. Given the emotional dynamics, trade entry after the losing crowd is finally eliminated tends to elicit more dependable trends with fewer whipsaws.
The investor who is willing to act against what may seem intuitive has thus factored other complexities into his/her calculations, and can see how various stock trends interact with other chart features, and thus is not stunned by variations in, or deviations from, textbook patterns. Such an investor is also aware of how these deviations can become more pronounced due to the emotional reaction of investors, which is a factor in itself that must be embedded in an assessment of market movements. These various factors, in combination, create unique scenarios which the investor anticipates, and which present an opportunity for him or her to make bold market moves, and even take long positions -- which could, against all odds, bring great profits.
Alan Farley can be contacted on this link: Hard Right Edge
We're taught early in our trading careers to buy breakouts and sell breakdowns, but many contrarians attempt to pay the bills doing the exact opposite. Simply stated, they wait for a rally or selloff to fail and sell the breakout or buy the breakdown. Oppositional tactics don't end there because tacticians employing these against-the-grain methods take the concept one step further and buy when the failure fails. Let's back up and examine this inverted thinking one step at a time.
Most of us follow a common path -- we pile into stocks, futures or forex pairs when they break out above easily observed resistance, but modern algorithms have been programmed to anticipate exactly how human traders will react when a breakout fails to attract momentum and rolls over. Using this knowledge, they intervene and guide price action down to levels where breakout traders are trapped and execute rapid fire short sales to generate additional downside momentum that completes the failure swing
Now, twist your brain and take this contrary reasoning to the next level. You’re victimized by this diabolical price action enough times that you learn from your experience and sit on your hands when a favorite play breaks out. The rally stalls and it sells off but you still wait, watch and do nothing. Then, once selling pressure has dissipated and it closes back above the breakout level, you jump in and buy, knowing that weak-handed players are no longer positioned. Make sense?
Let’s deconstruct what just happened. The original breakout attracts the typical momentum crowd, chasing the stock, futures contract or forex pair to higher ground without too much thought or strategy. The upside fizzles out and price turns lower, trapping those who haven’t protected positions with stops or profit-taking strategies. Fear takes hold when the decline cuts through the level that first signaled the breakout, forcing additional downside that sets off more bearish signals. The falling instrument eventually finds its footing and bounces in a fresh assault that penetrates the broken level. New buy signals go off, drawing our contrarian into a long position.
How do algorithms know where human traders will act emotionally? Simply stated, most of us take market exposure utilizing common strategies that have been deconstructed by smart money and their software code. As a result, stock, futures and forex prices seem to pass through support and resistance levels more easily now than in the past. Fortunately, when modern markets find new ways to take your money, they also provide new ways to make it.
Let’s look at three pattern failure setups and find contrary ways to profit from them.

A. A-B-C Failed Breakout
Walt Disney (DIS) topped out at84 inMarch after a strong rally. It built a trading range into May and broke out, but the uptrend stalled just two points higher, giving way to a failure swing that broke new support (blue line). The decline ended at the 50-day EMA, with the Dow component testing new resistance for two weeks and then surging higher. The second buying impulse off the low triggered a failure of a failure buy signal that preceded a new rally high.
It helps to visualize the breakout process as A-B-C wave patterns in which “A” marks the initial breakout surge, “B” the failure swing and “C” the resolution wave that lifts the price to a new rally high, or completes the failure with a decline that breaks the “B” low and sets off all sorts of short sale signals.

B. The 50-day EMA Flush
Apple (AAPL) ended a historic rally near101 inSeptember 2012 and entered a long correction. It returned to resistance in August 2014 and spent two months grinding sideways on top of the 50-day EMA (exponential moving average), before breaking down on October 15th. The stock hovered under new resistance for three sessions and shot higher, closing back above the 50-day EMA and then breaking out in a major uptrend just one session later.
This pattern failure occurs frequently, but many traders fail to notice the enormous opportunity it sets into motion, especially when price action unfolds in a widely held issue like Apple. It also illustrates how failure swings can interact with other charting features, generating positive feedback loops that ignite long-term trends. This is especially true when the 50-day EMA comes into play because it denotes the most common intermediate support level, with successful tests having the power to draw many sidelined players into new long positions.

C. The 62-78 Fibonacci Whipsaw
Small cap biotech Esperion Therapeutics (ESPR) tapped into a supply of momentum traders when it broke out of a long base in September 2014. The vertical rally nearly doubled the stock’s price in just two weeks, yielding a short-term top at 30.38 followed by a steep retracement that accelerated mid-month, when it gapped down into the upper teens on heavy volume. A Fibonacci grid placed over the edges of the uptrend organizes the chaos, with the decline breaking typically strong support at the 62% retracement and coming to rest at the 78.6% retracement. This 62-78 failure combination occurs frequently and often precedes a major buying opportunity by a few price bars. The trade entry strategy is simple: wait for price to close back above the 62% level and enter a long position as close to that price as possible
Intraday traders should find this pattern failure technique especially useful because it shows up frequently on 15-minute and 60-minute charts. Relatively tight stop losses are needed regardless of holding period because price action tends to be volatile near these major inflection points. It also helps when other support criteria align with the 62% retracement level, like the 50-day EMA in this example.
In Summary
Pattern failure setups can provide higher reward opportunities than textbook strategies because they catch the emotional crowd leaning the wrong way. While most traders understand how patterns are supposed to work, they get confused when real-time market behavior doesn’t match their expectations. In addition, they tend to put on blinders and get trapped as these failure events unfold. This deer in the headlights paralysis feeds on directional movement until the pain becomes too great and they capitulate. Given the emotional dynamics, trade entry after the losing crowd is finally eliminated tends to elicit more dependable trends with fewer whipsaws.
The investor who is willing to act against what may seem intuitive has thus factored other complexities into his/her calculations, and can see how various stock trends interact with other chart features, and thus is not stunned by variations in, or deviations from, textbook patterns. Such an investor is also aware of how these deviations can become more pronounced due to the emotional reaction of investors, which is a factor in itself that must be embedded in an assessment of market movements. These various factors, in combination, create unique scenarios which the investor anticipates, and which present an opportunity for him or her to make bold market moves, and even take long positions -- which could, against all odds, bring great profits.
Alan Farley can be contacted on this link: Hard Right Edge
Last edited by a moderator:
