Table m, I got back in this morning, hope you did.(hopefully I will hold it this time!)
I did a long trade late on friday evening.
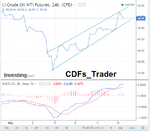
See daily chart: for me, price action was bullish, price closing higher, long thick green candle bars (couple of red candles but overall green, higher positive closes showed me bullish).
1 chart: I had an 'intraday' support line lets say, of 47.91, the previous day this was also an area where the price action had gone up.
When the price dropped below this level I switch to 5 min chart for entry, see chart attached.
I went long at 47.87 at 15.25
I looked for candle bars outside bollinger, sotch and rsi to be on their extremes. Ideally would have got in lower.
It went offside a bit , but then came back in the money.
I came out at 47.95, not huge profit but it was late on friday and I don't hold positions over night (or weekend!), but noticed that at 8.30pm price got to as high as 48.20, if holding this could still be in the money now.
This was not the ideal entry, as usually I wait for the 1 hour candle chart to close before entering, so I would have entered after 4pm. And using my 5 min entry strategy, i wouldnt have gone in after 4pm.
Bit of complacency in sticking to my strategy, but I went for it maybe out of boredom trading.
Will try and show a better entry for oil if i get one next week.


