GREY1 P/L daily

leovirgo said:
Dear Grey1

I am now using NYSE advance/decline as market mood. Normally, when advance minus decline is greater than 1000, I go long on my VWAP signals. For example today, AAPL, AKAM and EXPD have long signals around 14.50-1500hrs. I'd like to know what you think about this approach. thank you,..

best regards,

Why donot you use MACCI 10 min on $indu.. Go long When MACCI 10 min is -100 and turning .

Also remember , indicators are nothing but an indication and indication is not bullet proof rule.

Remember you must first determine if the market is trending or oscillating ..
grey1
 
Hi Grey1 and Leovirgo,

Thanks Leovirgo for asking that question, since I’ve seen your question in several articles lately. Grey1 your answer was great, for the last two months, we’ve had many Trending-Days. I remembered your statement for trending days are when the DOW > + / - 50. It stood the test today as well.

I just wanted to add that whenever the 5-Min Chart on the Dow has it’s 5, 10 & 20EMA’s lined up, almost parallel and trending up (as it has), and MACCI’s continue to be O/B over and over again – That’s a strong trend. I use it as a confirmation of a trend with DOW's > + / - 50.00.

So if I may repeat your last sentence Grey1, and add to it: We traders must determine if the market is:

1) Market can be in 3 different states: Trending (Dow > + / - 50 [net change]), or Oscillating (follow the MACCI O/B or O/S indicators), or in Consolidation (no trades).

1, a) Next, if the Market is Trending – you can only go in the direction of the Trend (lately it’s been Long). The MACCI’s will continue to oscillate in this kind of market but the higher TF’s will not bounce from O/B to O/S, they’ll stay O/B (in an up Trend). Also, as my input, I utilize the 5-Min 3EMA’s as trend confirmation (you can visually see this). If the 5 & 10EMA’s are not broken, you are still in a trend. This is why you just can’t watch the MACCI oscillators; watch the direction/trend of the market. The whole point here is that when the Market is Trending, you have to be very careful on catching when the Market changes from Trending to Oscillating. Today, it occurred (apprx around 11:30 ET) when the DOW “broke down” through + 50.0 (net change, and going lower), and the 5-Min’s “DOW, 5EMA finally “broke down” through the 10 & 20EMA. The DOW MACCI’s at this time were as follows = 5-Min (+ 28), 10-Min (+ 85), and the 15-Min (+ 101). Bottom line the market changed from Trending to Oscillation around 11:30 ish ET). I’ll repeat, I only use the 3EMA’s together as a trend confirmation tool, while the + / - 50 DOW is the easier leading Trend indicator. But there is another issue here, is that the Market may turn back up into a Trending mode, as it has as I’m writing this at 11:41 ET, where the DOW “broke up” through + 50. Well, around 11:46 ET, the Dow went & broke down through + 50, and is currently at + 42.46. But it does seem as the Dow has broken the trend, since the MACCI’s, in the higher TF’s are getting weaker, and the Dow’s direction continues down.

2) If the Market is Oscillating – the Market’s “direction” must turn in the MACCI’s direction. As Grey1 just stated, the 10-Min MACCI must be –100 and turn before you go Long.

3) If the Market is in Consolidation – narrow chop, chop, in an up and down in a channelling mode – do not trade. Same goes with stocks, don’t trade stocks, which are in Consolidation. Consolidation and Oscillation have two very different meanings to us trades, don't confuse them.

4) Now it’s stock selection time (select Strongest stock when Market is O/S, and Weakest stock when Market is O/B), and the stock’s price must also follow the Markets direction, etc……………….

One more thing, I find that placing Horizontal lines for HOD & LOD on my 5-Min chart at 10:00 ET, helps me to visualize the markets direction (strength or weakness), no more than that.

Note the majority of my explanations are Grey1's methods, where I just repeated them to clarify Trending vs Oscillating Markets.

Grey1, if you have any comments (good or bad) about using the 3 EMA’s on a 5-Min as trend confirming, let me know. Thanks!

Nas
 
Last edited:
Nastrader said:
Hi Grey1 and Leovirgo,

Thanks Leovirgo for asking that question, since I’ve seen your question in several articles lately. Grey1 your answer was great, for the last two months, we’ve had many Trending-Days. I remembered your statement for trending days are when the DOW > + / - 50. It stood the test today as well.

I just wanted to add that whenever the 5-Min Chart on the Dow has it’s 5, 10 & 20EMA’s lined up, almost parallel and trending up (as it has), and MACCI’s continue to be O/B over and over again – That’s a strong trend. I use it as a confirmation of a trend with DOW's > + / - 50.00.

So if I may repeat your last sentence Grey1, and add to it: We traders must determine if the market is:

1) Market can be in 3 different states: Trending (Dow > + / - 50 [net change]), or Oscillating (follow the MACCI O/B or O/S indicators), or in Consolidation (no trades).

1, a) Next, if the Market is Trending – you can only go in the direction of the Trend (lately it’s been Long). The MACCI’s will continue to oscillate in this kind of market but the higher TF’s will not bounce from O/B to O/S, they’ll stay O/B (in an up Trend). Also, as my input, I utilize the 5-Min 3EMA’s as trend confirmation (you can visually see this). If the 5 & 10EMA’s are not broken, you are still in a trend. This is why you just can’t watch the MACCI oscillators; watch the direction/trend of the market. The whole point here is that when the Market is Trending, you have to be very careful on catching when the Market changes from Trending to Oscillating. Today, it occurred (apprx around 11:30 ET) when the DOW “broke down” through + 50.0 (net change, and going lower), and the 5-Min’s “DOW, 5EMA finally “broke down” through the 10 & 20EMA. The DOW MACCI’s at this time were as follows = 5-Min (+ 28), 10-Min (+ 85), and the 15-Min (+ 101). Bottom line the market changed from Trending to Oscillation around 11:30 ish ET). I’ll repeat, I only use the 3EMA’s together as a trend confirmation tool, while the + / - 50 DOW is the easier leading Trend indicator. But there is another issue here, is that the Market may turn back up into a Trending mode, as it has as I’m writing this at 11:41 ET, where the DOW “broke up” through + 50. Well, around 11:46 ET, the Dow went & broke down through + 50, and is currently at + 42.46. But it does seem as the Dow has broken the trend, since the MACCI’s, in the higher TF’s are getting weaker, and the Dow’s direction continues down.

2) If the Market is Oscillating – the Market’s “direction” must turn in the MACCI’s direction. As Grey1 just stated, the 10-Min MACCI must be –100 and turn before you go Long.

3) If the Market is in Consolidation – narrow chop, chop, in an up and down in a channelling mode – do not trade. Same goes with stocks, don’t trade stocks, which are in Consolidation. Consolidation and Oscillation have two very different meanings to us trades, don't confuse them.

4) Now it’s stock selection time (select Strongest stock when Market is O/S, and Weakest stock when Market is O/B), and the stock’s price must also follow the Markets direction, etc……………….

One more thing, I find that placing Horizontal lines for HOD & LOD on my 5-Min chart at 10:00 ET, helps me to visualize the markets direction (strength or weakness), no more than that.

Note the majority of my explanations are Grey1's methods, where I just repeated them to clarify Trending vs Oscillating Markets.

Grey1, if you have any comments (good or bad) about using the 3 EMA’s on a 5-Min as trend confirming, let me know. Thanks!

Nas

NAs

thanks for above . I have always said , if there is a methodology that you are happy with and works for you then use it . There fore if 3EMA and 5 EMA have proven to be useful in your trading then i would suggest you to use ,, However , there is no technical reason that 3EMA or X MA should signal a change of trend . Trend change because cycles come to end. Therefore as a trader you must be chasing the cycle and what phase of the cycle stock or market going through and u gauge that using an oscillator such as RSI , MACCI and so on .. .

The challenge in TA is to find the reversal points using cycles and to do that you need a concept such as Exhaustion engine but in many many time frames instead of basic 1.3.5 min .


when the TOP NODES of cycles in different time frames match and meet then the reversal occurs . The more number of cycles NODE'S meet,, the heavier the reversal and hence a new trend is born ...


Grey1
 
Nastrader said:
I just wanted to add that whenever the 5-Min Chart on the Dow has it’s 5, 10 & 20EMA’s lined up, almost parallel and trending up (as it has), and MACCI’s continue to be O/B over and over again – That’s a strong trend. I use it as a confirmation of a trend with DOW's > + / - 50.00.

So if I may repeat your last sentence Grey1, and add to it: We traders must determine if the market is:

1) Market can be in 3 different states: Trending (Dow > + / - 50 [net change]), or Oscillating (follow the MACCI O/B or O/S indicators), or in Consolidation (no trades).

Nas

Nastrader,

Thanks for your comments. Do you code your rules in Radar Screen? I am now trying to link external market conditions with internal/individual stock conditions, in a way coding top down approach inside RS. I find that GVs are very useful in doing so.
 
Grey1 said:
Why donot you use MACCI 10 min on $indu.. Go long When MACCI 10 min is -100 and turning .

Also remember , indicators are nothing but an indication and indication is not bullet proof rule.

Remember you must first determine if the market is trending or oscillating ..
grey1

Grey1,

I always appreciate your wisdom. I went long NIHD at the close of 13th, sold out the following day for 130cents profits. The knowledge that I've gained from this TT thread is invaluable. Mucha gracias ...
 
Grey1 said:
Nas

thanks for above . I have always said , if there is a methodology that you are happy with and works for you then use it . There fore if 3EMA and 5 EMA have proven to be useful in your trading then i would suggest you to use ,, However , there is no technical reason that 3EMA or X MA should signal a change of trend . Trend change because cycles come to end. Therefore as a trader you must be chasing the cycle and what phase of the cycle stock or market going through and u gauge that using an oscillator such as RSI , MACCI and so on .. .

The challenge in TA is to find the reversal points using cycles and to do that you need a concept such as Exhaustion engine but in many many time frames instead of basic 1.3.5 min .

when the TOP NODES of cycles in different time frames match and meet then the reversal occurs . The more number of cycles NODE'S meet,, the heavier the reversal and hence a new trend is born ...
Grey1
Hi Grey1,

You are absolutely right; the 5EMA, 10EMA, & 20 EMA’s on a 5-Min Chart have no technical reason to signal a change of trend in the Market. Note, I used 3 EMA’s (as three EMA’s) = together as all three, I don’t use the 3 EMA for this purpose. Also, I do not look for a change in trend using this method, only its continuation. Thus the Market is in a Strategy # 1 mode when this occurs.

Perhaps I wasn’t clear enough in my statement. My only reason to use the 5EMA, 10EMA, & 20EMA is only to “confirm” that a Trend in the Market and/or Stock is established and continuing. I utilize in combination with the Markets O/B (MACCI’s - leading TA indicator), and the three EMA’s mentioned only to provide confirmation that the Market direction is in a Trend.

Since in the last few months, the Market has continued to make new 52 Wk Hi’s in a Trending mode (intra-day), thus this method has prevented me from entering a short when the Market indicated a very strong O/B MACCI condition in multi - TF’s. When the Market is trending, then I switch into your Strategy # 1, “Long the strongest stock.” It’s just that I wanted to be prevented from using Strategy # 3 in a Trending Market – that is all.

I understand your TA thought process as it relates to MA’s, and thanks for your clarification.

As usual, I greatly appreciate your comments and continued sharing of your trading knowledge.

NasTrader
 
leovirgo said:
Nastrader,

Thanks for your comments. Do you code your rules in Radar Screen? I am now trying to link external market conditions with internal/individual stock conditions, in a way coding top down approach inside RS. I find that GVs are very useful in doing so.
Hi Leovirgo,

Sorry, but I do not have Radar Screen; I have the Real Tick (RT) Platform, which doesn't have Easy Language. Radar Screen seems to be much more robust, but since I know RT inside & out (have been using it for many years), I’m sticking with what I have.

NasTrader
 
Friday's Market Oscillations

Start Quote:
Nas
The challenge in TA is to find the reversal points using cycles and to do that you need a concept such as Exhaustion engine but in many many time frames instead of basic 1.3.5 min .

when the TOP NODES of cycles in different time frames match and meet then the reversal occurs . The more number of cycles NODE'S meet,, the heavier the reversal and hence a new trend is born ...
Grey1
End Quote:

Hi Grey1,

After reading your reply to post # 743 from Friday, I did some OB, OS comparisons in Multi-TF’s, that is, in 1, 3, 5, 10, 15, & 30-Min TF’s. Your comments made a lot of sense, and it caused me to make some analysis. Since, I had this complete and was trying to analyze the market, I’ve attached the data in MS Excel, and see the "notes" in 2nd Tab of the Excel sheet. The excel lists all of the peaks & valleys MACCI values & exact time they occurred in each TF. This analysis of the peak (O/B) & valleys (O/S) when compared to the Dow charts listed below, indicated that it's the fall of the MACCI's form their peaks when in combination with other TF's and is the key to ID for a proper short. I was disappointed that the excel analysis wasn't the holy grail - LOL.

Also, the 1st Dow Charts in same TF’s are attached in MS Word (Dow Charts, in Multi-f TF's,m 12-15-06). On Sunday, I reviewed the Dow Charts again, and realized that theses 1st Charts were not the correct way ID proper oscillations for a short, so I quickly did another analysis on the Dow and attached them as the 2nd Dow Charts in MS Word (Dow Charts, Multi TF's, 12-17-06). The MACCI’s which I normally use are the 1, 5, 10, & 15-Min. I'm still trying to get a handle on this strategy, and improve my understand on their optimum use.

------------------------------------------------------------------------------------------------
The 1st & wrong method I used (Dow Charts, in Multi TF's, 12-15-06):
I went through each chart and annotated the MACCI’s 1st fall below it’s previous low – like a Break Down (B/D). The 1-Min Chart was the least helpful, and its B/D occurred at 10: 15, B/D thru the “0” MACCI line with no confirmation in the Other TF’s. With the many cycles in the 1-Min chart, how can one tell which MACCI falling from its O/B condition is correct? The 3-Min’s MACCI did it’s 1st fall below its previous low at 11:18, with a MACCI of + 60.

The 1st set of Dow Charts, the 5, 10 & 15-Min MACCI’s were hit and were the best indication of the oscillations falling between 11:15 and 11:25 ET. The following are a summary of each TF (O/B) indication of falling below its previous low (also shown on the Charts):

1-Min, MACCI’s fell thru “0” at 10:15
3-Min, MACCI’s fell thru + 60 at 11:18
5-Min, MACCI’s fell thru + 90 at 11:25
10-Min MACCI’s fell thru + 100 at 11:20
15-Min MACCI’s fell thru + 138 at 11:15
30-Min MACCI’s fell thru + 110 at 13:00
---------------------------------------------------------------------------------

The 2nd method I used on Sunday (Dow Charts, Multi TF's, 12-17-06) - with better results:

I used the same TF's, and drew a "trend line" on the bottom of the Dow on a 3-Min chart first. Next, I made a vertical line straight down to align & cross with the MACCI Value & Time in all TF's. Obviously this may not the proper method, but is about as close as the best which can be used to match the proper MACCI value & time to start looking for the weakest stocks to short. An interesting thing which I found doing this analysis method, was by using the same trend lines (after I used the 3-Min chart & trend lines) when I changed my charts to 5-Min thru the 15-Min, the trend line (obviously) stayed the same, but the vertical line stayed in the same location crossing the MACCI as it was falling - calling for a short. Coincidently, the MACCI values between the 3-Min & 15-Min were all > + 100 (O/B), although the 5-Min was + 95 at the MACCI & Time intersecting lines. Therefore, this was a very strong signal, between 11:10 and 11:15 or 12:00 to short a stock. The following data are a summary of each TF from this 2nd Dow Charts:

1-Min, MACCI = + 5, 11:14
3-Min, MACCI = + 120, 11:12
5-Min, MACCI = + 95, 11:10
10-Min, MACCI = + 120, 11:10
15--Min, MACCI = + 138, 11:15
30-Min, MACCI = + 140, 12:00

Now I am far from being an expert in this strategy, I am trying to better understand this concept.

Therefore, Grey1 would you be so kind as to review the 2nd Dow Chart analysis (Dow Charts, Multi TF's, 12-17-06), which I’ve constructed with Charts & MACCI values for Friday, 12/15/06, and let me know if my review using the 2nd Dow Charts is correct? I would like to fine tune this strategy on MACCI oscillations - thanks!

NasTrader
 

Attachments

  • DOW OB OS in Multi TF's, 12-15-06.xls
    29 KB · Views: 21
  • Dow Charts, in Mutli TF's, 12-15-06.doc
    241.5 KB · Views: 21
  • Dow Charts, Mutli TF's, 12-17-06.doc
    237 KB · Views: 13
Last edited:
Nastrader said:
Start Quote:
Nas
The challenge in TA is to find the reversal points using cycles and to do that you need a concept such as Exhaustion engine but in many many time frames instead of basic 1.3.5 min .

when the TOP NODES of cycles in different time frames match and meet then the reversal occurs . The more number of cycles NODE'S meet,, the heavier the reversal and hence a new trend is born ...
Grey1
End Quote:

Hi Grey1,

After reading your reply to post # 743 from Friday, I did some OB, OS comparisons in Multi-TF’s, that is, in 1, 3, 5, 10, 15, & 30-Min TF’s. Your comments made a lot of sense, and it caused me to make some analysis. Since, I had this complete and was trying to analyze the market, I’ve attached the data in MS Excel, and see the "notes" in 2nd Tab of the Excel sheet. The excel lists all of the peaks & valleys MACCI values & exact time they occurred in each TF. This analysis of the peak (O/B) & valleys (O/S) when compared to the Dow charts listed below, indicated that it's the fall of the MACCI's form their peaks when in combination with other TF's and is the key to ID for a proper short. I was disappointed that the excel analysis wasn't the holy grail - LOL.

Also, the 1st Dow Charts in same TF’s are attached in MS Word (Dow Charts, in Multi-f TF's,m 12-15-06). On Sunday, I reviewed the Dow Charts again, and realized that theses 1st Charts were not the correct way ID proper oscillations for a short, so I quickly did another analysis on the Dow and attached them as the 2nd Dow Charts in MS Word (Dow Charts, Multi TF's, 12-17-06). The MACCI’s which I normally use are the 1, 5, 10, & 15-Min. I'm still trying to get a handle on this strategy, and improve my understand on their optimum use.

------------------------------------------------------------------------------------------------
The 1st & wrong method I used (Dow Charts, in Multi TF's, 12-15-06):
I went through each chart and annotated the MACCI’s 1st fall below it’s previous low – like a Break Down (B/D). The 1-Min Chart was the least helpful, and its B/D occurred at 10: 15, B/D thru the “0” MACCI line with no confirmation in the Other TF’s. With the many cycles in the 1-Min chart, how can one tell which MACCI falling from its O/B condition is correct? The 3-Min’s MACCI did it’s 1st fall below its previous low at 11:18, with a MACCI of + 60.

The 1st set of Dow Charts, the 5, 10 & 15-Min MACCI’s were hit and were the best indication of the oscillations falling between 11:15 and 11:25 ET. The following are a summary of each TF (O/B) indication of falling below its previous low (also shown on the Charts):

1-Min, MACCI’s fell thru “0” at 10:15
3-Min, MACCI’s fell thru + 60 at 11:18
5-Min, MACCI’s fell thru + 90 at 11:25
10-Min MACCI’s fell thru + 100 at 11:20
15-Min MACCI’s fell thru + 138 at 11:15
30-Min MACCI’s fell thru + 110 at 13:00
---------------------------------------------------------------------------------

The 2nd method I used on Sunday (Dow Charts, Multi TF's, 12-17-06) - with better results:

I used the same TF's, and drew a "trend line" on the bottom of the Dow on a 3-Min chart first. Next, I made a vertical line straight down to align & cross with the MACCI Value & Time in all TF's. Obviously this may not the proper method, but is about as close as the best which can be used to match the proper MACCI value & time to start looking for the weakest stocks to short. An interesting thing which I found doing this analysis method, was by using the same trend lines (after I used the 3-Min chart & trend lines) when I changed my charts to 5-Min thru the 15-Min, the trend line (obviously) stayed the same, but the vertical line stayed in the same location crossing the MACCI as it was falling - calling for a short. Coincidently, the MACCI values between the 3-Min & 15-Min were all > + 100 (O/B), although the 5-Min was + 95 at the MACCI & Time intersecting lines. Therefore, this was a very strong signal, between 11:10 and 11:15 or 12:00 to short a stock. The following data are a summary of each TF from this 2nd Dow Charts:

1-Min, MACCI = + 5, 11:14
3-Min, MACCI = + 120, 11:12
5-Min, MACCI = + 95, 11:10
10-Min, MACCI = + 120, 11:10
15--Min, MACCI = + 138, 11:15
30-Min, MACCI = + 140, 12:00

Now I am far from being an expert in this strategy, I am trying to better understand this concept.

Therefore, Grey1 would you be so kind as to review the 2nd Dow Chart analysis (Dow Charts, Multi TF's, 12-17-06), which I’ve constructed with Charts & MACCI values for Friday, 12/15/06, and let me know if my review using the 2nd Dow Charts is correct? I would like to fine tune this strategy on MACCI oscillations - thanks!

NasTrader
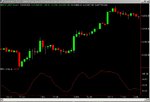
Hi

That is because your MACCI is not correct on RT ...

This is the chart of DOW 30 min and is different to yours . The first turn on MACCI 12/15 resulted in a good correction . your Engine should have signaled that ..

when the EE signals exhasution you more than often get a correction .. If you looking for a reversal you must extend your time frame to 30 MIN , 20MIN , 10 MIN
 

Attachments

  • DOW.jpg
    DOW.jpg
    155.8 KB · Views: 54
Grey1 said:
Hi

That is because your MACCI is not correct on RT ...

This is the chart of DOW 30 min and is different to yours . The first turn on MACCI 12/15 resulted in a good correction . your Engine should have signaled that ..

when the EE signals exhasution you more than often get a correction .. If you looking for a reversal you must extend your time frame to 30 MIN , 20MIN , 10 MIN
Hi Grey1,

Thanks for your comments.

What I understand from what you’ve said is that with the “Top Down Approach” also use the higher TF’s first to find the oscillation’s turn, and then look for confirmation in the lower TF’s.

Yes, the Dow did give me signals at 10:21 (I just happened save that when 10 & 15 Min went RED, with MACCI values) in the 10 & 15-Min TF with MACCI’s of + 139 (10-Min) & + 121 (15-Min) signaling O/B.

You are correct, in that my MACCI is slightly different than yours. I use CCI-20, smoothed with 6 MA.

I noticed on your chart a MACCI (6,5), is that different than what I'm using? The "5" after the 6 MA, looks different than what I'm using.

Also, is there a reason, that you didn't list 15-Min? You seem to use 10-Min increased increments after the 10-Min with 20-Min & 30-Mins.

Thanks again,

NasTrader
 

Attachments

  • Dow 30-Min, 12-15-06.doc
    39 KB · Views: 17
Last edited:
Took SNDK , BRCM RIMM andNVDA trade with $ 2240 profit in 30 min . NVDA Signal hit the target and disappeared

grey1
 

Attachments

  • Trade213.png
    Trade213.png
    18.1 KB · Views: 111
Grey1 said:
Took SNDK , BRCM RIMM andNVDA trade with $ 2240 profit in 30 min . NVDA Signal hit the target and disappeared

grey1

Gentlemen,

Is anyone trading these days? I am finding just the open a bit tradeable and the rest of the day very slow. Its so slow that I feel asleep on my trading desk. Anyone finding this market tradable? G1, are you trading this market?

Thx
 
gulam said:
Gentlemen,

Is anyone trading these days? I am finding just the open a bit tradeable and the rest of the day very slow. Its so slow that I feel asleep on my trading desk. Anyone finding this market tradable? G1, are you trading this market?

Thx
I am trading every day none stop . I made $4210 yesterday, $3210 a day before intra day trading and I also made $3600 on swing TZOO and RTH since last Thursday. I am currently trading with FIBBO as I need him to keep his eyes on some of my trades as I am basket trading until my engine is fully automated. The market is extremely difficult because these levels on DOW is more of a psychological play than technical but engine still doing an awesome job. Saying that I had 90 % awesome signals yesterday from the engine and with great surprise 90% bad signals on last Wednesday which resulted in $2830 loss. I still donot know why on earth i had 90% wrong signals and both myself and FIBBO were shocked . I can only tell you that trading @ these levels is certainly not easy

I am up $ 1110 as we are now and looking for ward to get more signals from the engine later.
6 signals all short all wins and ERTS long which we both lost


grey
 
Happy Holidays !

Best Wishes for everyone’s Family and you for this Holiday Season.

and

Especially to Grey1 for his unselfish dedication to train us traders in the proper method of using TA and the Top Down Approach.


NasTrader
 
Last edited:
A merry christmas to you all, in particular all those people who were kind enough to offer help and guidance when I needed it, for free advice offered by posters on these boards, there are some really clever & intelligent soles who are completely unselfish in there kindness, I cannot thank you enough, God Bless and enjoy the holidays..........
 
Markets will also be Closed on Tuesday, Jan 2nd

HAPPY NEW YEAR TO ALL

As you are all aware, on Jan 1st the US Equity Markets are closed.

Due to the death of our past President, Gerald Ford, the US Markets will also be closed on Jan 2nd .

From NYSE Web Site - http://www.nyse.com/Frameset.html?d...2963613686.html
2007
New Year's Day January 1
National Day of Mourning **** January 2****

**** It was announced on December 29, 2006, that the New York Stock Exchange and NYSE Arca would be closed on Tuesday, Jan. 2, 2007 in observance of the national day of mourning for President Gerald R. Ford.
 
Nastrader said:
HAPPY NEW YEAR TO ALL

As you are all aware, on Jan 1st the US Equity Markets are closed.

Due to the death of our past President, Gerald Ford, the US Markets will also be closed on Jan 2nd .

From NYSE Web Site - http://www.nyse.com/Frameset.html?d...2963613686.html
2007
New Year's Day January 1
National Day of Mourning **** January 2****

**** It was announced on December 29, 2006, that the New York Stock Exchange and NYSE Arca would be closed on Tuesday, Jan. 2, 2007 in observance of the national day of mourning for President Gerald R. Ford.

Cheers dude............
 
Up $2400 for the day with FIBBO trading 1/10 th of my pos size so he is up $240 . The signals are much better with far better entry .....

Just check the signal time against the BID and ASK and even better against BID and ASK 1 hour from the posting of this text .. Can not get more real time trade than this lol

iraj
 

Attachments

  • Trade246.png
    Trade246.png
    20.2 KB · Views: 82
Last edited:
Grey1 said:
Up $2400 for the day with FIBBO trading 1/10 th of my pos size so he is up $240 . The signals are much better with far better entry .....

Just check the signal time against the BID and ASK and even better against BID and ASK 1 hour from the posting of this text .. Can not get more real time trade than this lol

iraj

After the hours, I will discuss few technical issues on CYCLES and TRENDS for more advanced traders .. What if i tell you to catch a trend you need to be on right side of the cycle? what if i tell you you can catch trend before happening than wait for your MA.ADX, MACD junk to give you second rated old and lagged signal .

I think all serious traders should look into cycles and nodes matching .

Iraj
 
Top