Gold, Silver and Crude Oil thread

Interesting to see long term P&f on gold since the lows......... which seems to show two legs up and two pullbacks. The first of $180 (720 down to 540 roughly) and the second is happening now and if we use 1030HI then the floor at 850 would give equality ... some charts use 1020 and so the floor becomes 840 for equality...

So what ? It could mean we might be ready to resume the upside with new highs ??? Yes there are bearish indications out there but so long as 840/50 holds I can't get too skittish! I'm watching to see if we can "regain" 900....

Prices are for spot Gold.

Kitco - Commentaries - Merv Burak CMT
 
Let me know if anyone here is starting to hoard silver like a crazy person.

silver2.gif
 
Last edited:
Yeah, oh well. Gold and oil coming off of the highs...just be ready to take a short position! or a long, who knows what will happen.
 
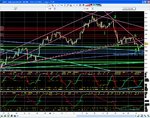
Yesterday there was a v nice long setup off S @ *894-896,TL support, Bullish Regular Divergence and a completed 5 wave formation on the 4hr chart.

*i.e. obvious stops @ 900 or just below were rinsed away.
 

Attachments

  • Spot Gold 894-896CAS TL 5W Bull Divg setup 1 of 2.JPG
    Spot Gold 894-896CAS TL 5W Bull Divg setup 1 of 2.JPG
    281.5 KB · Views: 198
  • Spot Gold 894-896CAS TL 5W Bull Divg setup 2 of 2.JPG
    Spot Gold 894-896CAS TL 5W Bull Divg setup 2 of 2.JPG
    300.6 KB · Views: 207
Background Info

CMBX Clusterf*** continues. :eek:

Not sure if a safety bid will occur on G, S or C when the equity boys and girls figure out that the exit door is ever so tiny.

Historical CMBX Graphs
 
Last edited:
gc comex monthly.

back in the support zone that has supported this gold rally, a =c since march highs also.

my.php
[/URL][/IMG]
 
OpEx fun and games.

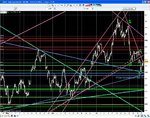
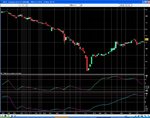
Bounce off 773 support line (see post #65 on page 7) and also 772-776 support zone for Gold Futures continuation contract (see post #57 on page 6).
 

Attachments

  • Spot Gold 150808 8 tick chart.JPG
    Spot Gold 150808 8 tick chart.JPG
    202.7 KB · Views: 255
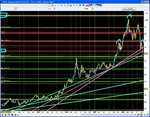
Latest Spot Gold weekly.

Two Ascending TrendLines broken.

A barely definable HnS. Price Projection of (773 - (1033-773))= 513.

Interestingly, 513 would be just below 50% of the ATH and just below congestion area support and the 61.8% retrace of the upmove from 1999.
 

Attachments

  • Spot Gold weekly 100908.JPG
    Spot Gold weekly 100908.JPG
    270.2 KB · Views: 219
Possible Bottom In Gold

Their is a possible bottom in gold signalled on my 4hr chart. Just a heads up to those who are shorting it.
TEAMTRADER
 
You'd think ... but people probably thought it would turn up from $50 - a very strong psychological level, I would have thought.

I would not be surprised if it turned back up, but I would also not be surprised if it went down to $30. We would then be wondering again what would happen :)


Regards,
M.
 
Top